\n
## Scatter Plot: Confidence vs. Target Length (abstract_algebra)
### Overview
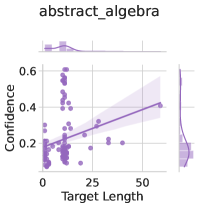
The image presents a scatter plot visualizing the relationship between "Target Length" and "Confidence". A linear regression line is overlaid on the scatter points, along with a shaded confidence interval around the regression line. Marginal histograms are displayed above and to the right of the main plot, showing the distributions of "Target Length" and "Confidence" respectively. The plot is labeled "abstract_algebra" at the top.
### Components/Axes
* **X-axis:** "Target Length" - Scale ranges from approximately 0 to 55.
* **Y-axis:** "Confidence" - Scale ranges from approximately 0.1 to 0.6.
* **Scatter Points:** Purple circles representing individual data points.
* **Regression Line:** A purple line representing the linear relationship between Target Length and Confidence.
* **Confidence Interval:** A light purple shaded area around the regression line, indicating the uncertainty in the estimated relationship.
* **Marginal Histogram (Top):** Displays the distribution of "Target Length".
* **Marginal Histogram (Right):** Displays the distribution of "Confidence".
### Detailed Analysis
The scatter plot shows a generally positive, but weak, correlation between "Target Length" and "Confidence".
* **Regression Line Trend:** The regression line slopes upward, indicating that as "Target Length" increases, "Confidence" tends to increase. However, the slope is relatively shallow.
* **Data Point Distribution:** The data points are widely scattered, indicating a substantial amount of variability.
* **Data Points (Approximate Values):**
* At Target Length = 0, Confidence ranges from approximately 0.1 to 0.3.
* At Target Length = 25, Confidence ranges from approximately 0.15 to 0.4.
* At Target Length = 50, Confidence ranges from approximately 0.3 to 0.5.
* **Marginal Histogram (Target Length):** The distribution of "Target Length" appears to be skewed to the right, with a concentration of values near 0 and a tail extending towards higher values.
* **Marginal Histogram (Confidence):** The distribution of "Confidence" appears to be roughly symmetrical, with a peak around 0.25.
### Key Observations
* The correlation between "Target Length" and "Confidence" is weak, as evidenced by the shallow slope of the regression line and the wide scatter of data points.
* The confidence interval is relatively wide, indicating a high degree of uncertainty in the estimated relationship.
* The marginal histograms reveal that "Target Length" is skewed, while "Confidence" is more symmetrically distributed.
### Interpretation
The data suggests that there is a slight tendency for "Confidence" to increase with "Target Length", but this relationship is not strong and is subject to considerable uncertainty. The weak correlation could be due to several factors, including the presence of other variables that influence "Confidence", or simply a lack of a strong underlying relationship. The skewed distribution of "Target Length" suggests that shorter target lengths are more common, which may influence the observed relationship. The marginal histograms provide additional context by showing the distributions of the individual variables, which can help to understand the overall pattern of the data. The label "abstract_algebra" suggests this data may relate to the performance or confidence levels in tasks related to abstract algebra, potentially the length of problems or proofs.