\n
## Scatter Plot: Confidence vs. Target Length - High School European History
### Overview
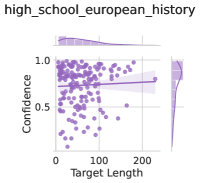
This image presents a scatter plot visualizing the relationship between "Target Length" and "Confidence" for a dataset labeled "high_school_european_history". A regression line and shaded confidence interval are overlaid on the scatter points. There are also two histograms at the top and right edges of the plot, showing the distributions of Target Length and Confidence, respectively.
### Components/Axes
* **X-axis:** "Target Length" - Scale ranges from approximately 0 to 250.
* **Y-axis:** "Confidence" - Scale ranges from approximately 0.2 to 1.2.
* **Scatter Points:** Purple dots representing individual data points.
* **Regression Line:** A purple line representing the trend of the data. It appears to be nearly horizontal.
* **Confidence Interval:** A shaded purple area around the regression line, indicating the uncertainty in the estimated trend.
* **Histogram (Top):** Displays the distribution of "Target Length". The distribution appears to be skewed to the left, with a concentration of values below 100 and a long tail extending to higher values.
* **Histogram (Right):** Displays the distribution of "Confidence". The distribution is heavily skewed to the right, with a concentration of values near 1.0 and a tail extending to lower values.
* **Title:** "high\_school\_european\_history" - Located at the top-left of the image.
### Detailed Analysis
The scatter plot shows a weak, potentially non-existent, linear relationship between "Target Length" and "Confidence".
* **Scatter Plot Trend:** The points are scattered with no clear upward or downward trend. The regression line is nearly horizontal, indicating a very small slope.
* **Data Points:**
* At Target Length = 0, Confidence ranges from approximately 0.3 to 1.0.
* At Target Length = 50, Confidence ranges from approximately 0.4 to 1.0.
* At Target Length = 100, Confidence ranges from approximately 0.3 to 0.9.
* At Target Length = 150, Confidence ranges from approximately 0.4 to 0.8.
* At Target Length = 200, Confidence ranges from approximately 0.5 to 0.7.
* At Target Length = 250, Confidence is limited to a single point around 0.6.
* **Regression Line:** The regression line is approximately horizontal at a Confidence value of around 0.75.
* **Histogram (Target Length):** The histogram shows a peak around a Target Length of 50, with a decreasing frequency as Target Length increases.
* **Histogram (Confidence):** The histogram shows a peak at a Confidence value of 1.0, with a decreasing frequency as Confidence decreases.
### Key Observations
* The scatter plot shows a very weak correlation between Target Length and Confidence.
* The confidence interval is relatively wide, indicating a high degree of uncertainty in the estimated relationship.
* The histograms reveal that Target Length and Confidence have different distributions. Target Length is skewed left, while Confidence is skewed right.
* There is a cluster of points with high confidence (close to 1.0) at lower Target Lengths.
### Interpretation
The data suggests that the length of the target text does not significantly influence the confidence score for this "high\_school\_european\_history" dataset. The nearly horizontal regression line and wide confidence interval support this conclusion. The distributions of Target Length and Confidence are quite different, with shorter target lengths being more common and higher confidence scores being more frequent. The lack of a strong correlation could indicate that other factors, not captured in this analysis, are more important determinants of confidence. The histograms suggest that the model performs well on shorter texts, with high confidence, but the confidence decreases as the target length increases, although this decrease is not statistically significant based on the scatter plot. The right-skewed confidence distribution indicates that the model is generally confident in its predictions.