## Diagram: Cross-Shaped Dot Grid with Binary Color Encoding
### Overview
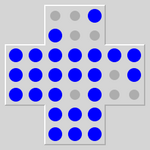
The image displays a cross-shaped diagram composed of five interconnected 4x4 square grids. Each grid contains 16 circular dots arranged in a 4x4 matrix. The dots are colored in one of two colors: a vibrant blue and a neutral gray. The overall shape forms a plus sign or cross, with a central square and four arms extending to the top, bottom, left, and right. There is no accompanying text, labels, axes, or legend within the image itself.
### Components/Axes
* **Structure:** A cross shape formed by five distinct 4x4 grids (Top Arm, Left Arm, Center, Right Arm, Bottom Arm).
* **Data Elements:** 80 total circular dots (16 per grid * 5 grids).
* **Color Encoding:** Two colors are used:
* **Blue:** A saturated, medium-dark blue.
* **Gray:** A neutral, medium gray.
* **Spatial Layout:**
* The **Center** grid is the intersection point.
* The **Top Arm** grid is directly above the Center.
* The **Bottom Arm** grid is directly below the Center.
* The **Left Arm** grid is directly to the left of the Center.
* The **Right Arm** grid is directly to the right of the Center.
* **Legend:** No explicit legend is present. The meaning of the blue vs. gray encoding is not defined in the image.
### Detailed Analysis
A precise count and positional analysis of the colored dots within each 4x4 grid (numbered 1-16, reading left-to-right, top-to-bottom):
**1. Top Arm Grid (Position: Top-Center)**
* **Blue Dots:** 12
* **Gray Dots:** 4
* **Pattern:** Gray dots are located at positions: 2, 4, 6, 8 (forming a diagonal from top-right to bottom-left within the top two rows).
**2. Left Arm Grid (Position: Center-Left)**
* **Blue Dots:** 14
* **Gray Dots:** 2
* **Pattern:** Gray dots are located at positions: 7, 11 (forming a vertical pair in the third column).
**3. Center Grid (Position: Center)**
* **Blue Dots:** 8
* **Gray Dots:** 8
* **Pattern:** A distinct checkerboard or alternating pattern. Gray dots are at positions: 2, 4, 5, 7, 10, 12, 13, 15. This creates a symmetrical, interlaced design.
**4. Right Arm Grid (Position: Center-Right)**
* **Blue Dots:** 12
* **Gray Dots:** 4
* **Pattern:** Gray dots are located at positions: 6, 8, 14, 16 (forming a diagonal from top-left to bottom-right within the bottom two rows).
**5. Bottom Arm Grid (Position: Bottom-Center)**
* **Blue Dots:** 16
* **Gray Dots:** 0
* **Pattern:** All dots are blue. This is the only grid with no gray dots.
**Summary Data Table (Reconstructed):**
| Grid Location | Total Dots | Blue Count | Gray Count | Gray Dot Positions (1-16) |
| :--- | :--- | :--- | :--- | :--- |
| Top Arm | 16 | 12 | 4 | 2, 4, 6, 8 |
| Left Arm | 16 | 14 | 2 | 7, 11 |
| Center | 16 | 8 | 8 | 2, 4, 5, 7, 10, 12, 13, 15 |
| Right Arm | 16 | 12 | 4 | 6, 8, 14, 16 |
| Bottom Arm | 16 | 16 | 0 | (None) |
| **TOTAL** | **80** | **62** | **18** | |
### Key Observations
1. **Symmetry and Asymmetry:** The Top and Right arms are mirror images in their gray dot placement (diagonals in opposite directions). The Left arm has a unique vertical pair. The Bottom arm is a complete outlier with no gray dots.
2. **Central Complexity:** The Center grid has the highest density and most complex pattern of gray dots (50% gray), forming a perfect checkerboard. This suggests it is the focal point or area of highest activity/variation.
3. **Gradient of "Activity":** If gray represents a state like "inactive," "selected," or "different," there is a clear gradient. The Bottom Arm is fully blue (0% gray), the Left Arm is mostly blue (12.5% gray), the Top and Right Arms are moderately mixed (25% gray), and the Center is highly mixed (50% gray).
4. **Absence of Text:** The diagram conveys all information purely through spatial arrangement and color contrast. Any meaning must be inferred from context not provided in the image.
### Interpretation
This diagram is a **spatial data visualization using a binary color code on a structured grid**. It likely represents the state, classification, or value of 80 discrete units arranged in a cross-shaped network or field.
* **What it Suggests:** The data demonstrates a non-uniform distribution. The central node (or region) exhibits the most heterogeneity or "mixed state." The arms show varying degrees of uniformity, with one arm (Bottom) being completely homogeneous. This could model scenarios like:
* A **sensor network** where the central hub has the most diverse readings.
* A **material sample** under analysis, with the center showing a different crystalline or composite structure.
* A **user interface or control panel** where the central area has the most active or toggled elements.
* A **game board or puzzle state** (e.g., a Minesweeper variant or logic puzzle).
* **Relationships:** The spatial relationship is key. The pattern in the Center is distinct from the arms. The Top and Right arms share a similar diagonal motif (mirrored), suggesting a related function or property. The Bottom arm's complete uniformity makes it a potential control, baseline, or "reset" state.
* **Notable Anomalies:** The **Bottom Arm** is the most significant anomaly. Its complete lack of gray dots breaks the pattern seen in all other arms and the center. This demands explanation—is it a different type of component, an uninitialized state, or a result of a specific process? The **Left Arm's** unique vertical pair of gray dots also stands out against the diagonal patterns in the Top and Right arms.
**In essence, the image encodes a dataset where location and binary state are intrinsically linked, revealing a structured yet non-uniform pattern with a highly active core and one distinctly uniform periphery.**