## Bar Chart: Question Length Distribution
### Overview
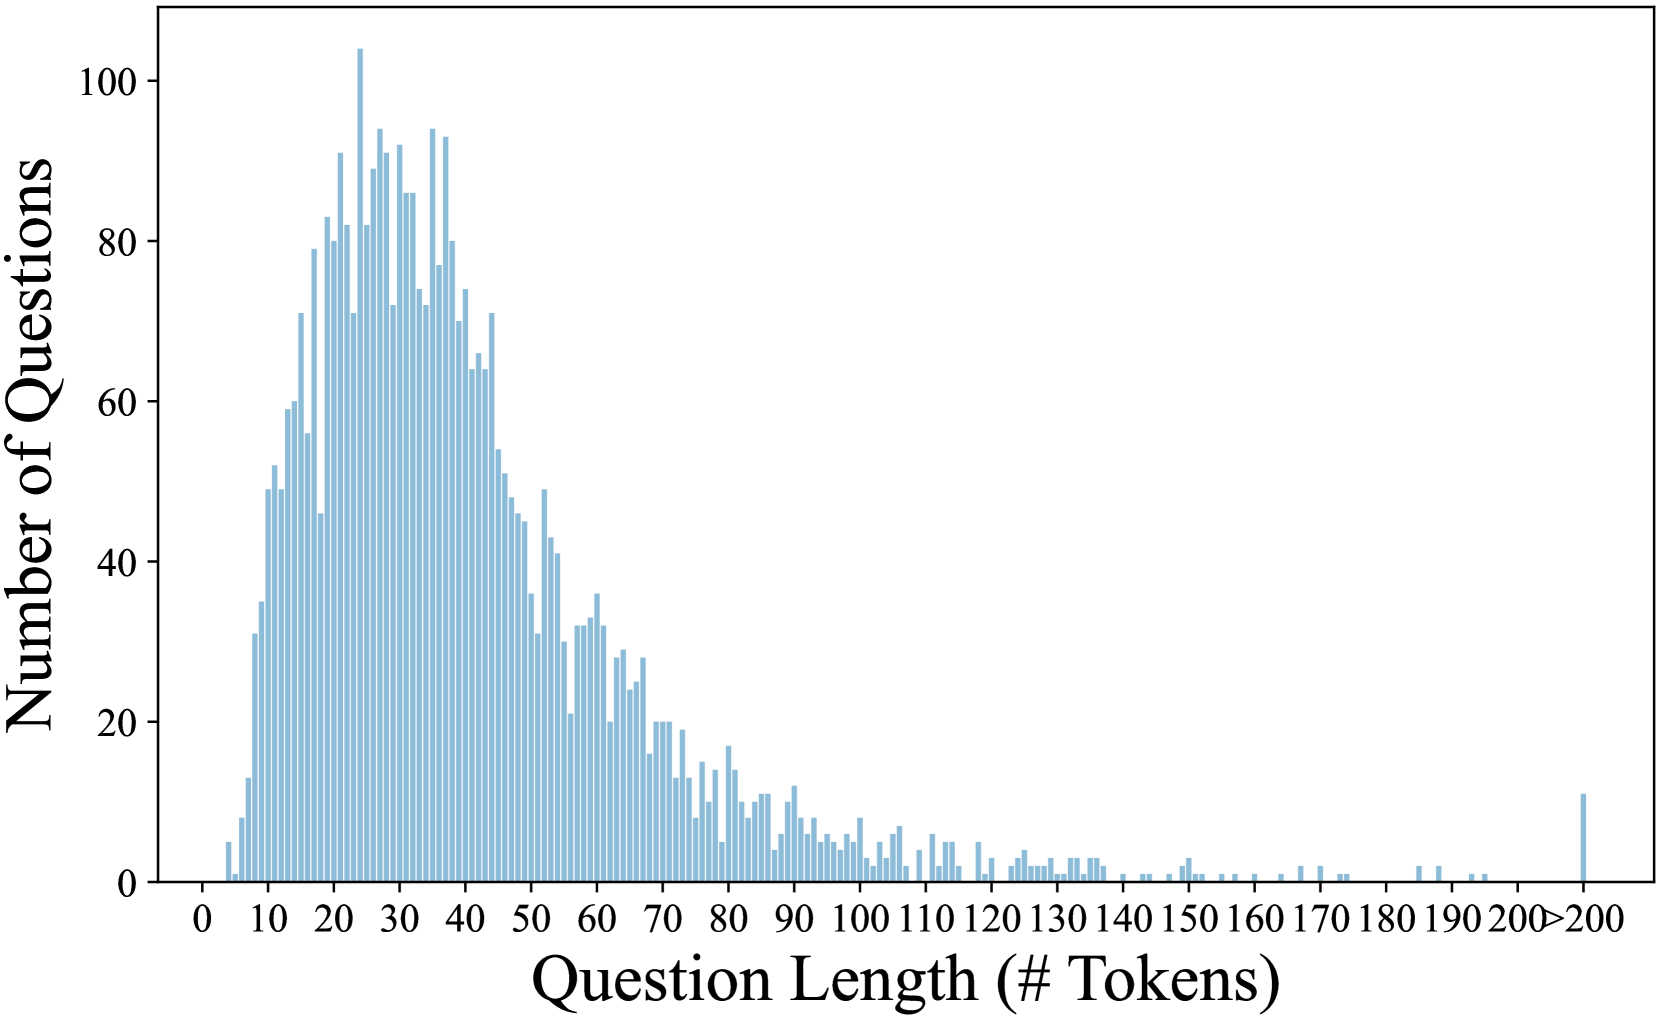
The image is a bar chart showing the distribution of question lengths, measured in the number of tokens. The x-axis represents the question length, and the y-axis represents the number of questions. The bars are light blue.
### Components/Axes
* **X-axis:** Question Length (# Tokens). The axis is labeled from 0 to 200 in increments of 10, with an additional label ">200" at the end.
* **Y-axis:** Number of Questions. The axis is labeled from 0 to 100 in increments of 20.
* **Bars:** Light blue bars represent the number of questions for each question length.
### Detailed Analysis
The distribution is skewed to the right.
* The number of questions increases rapidly from 0 tokens to a peak around 30-40 tokens.
* The number of questions then decreases gradually as the question length increases from 40 to 200 tokens.
* There is a small spike at the ">200" token mark.
Specific data points (approximate due to bar chart resolution):
* At 10 tokens, the number of questions is approximately 50.
* At 20 tokens, the number of questions is approximately 75.
* At 30 tokens, the number of questions is approximately 90.
* At 40 tokens, the number of questions is approximately 80.
* At 50 tokens, the number of questions is approximately 50.
* At 60 tokens, the number of questions is approximately 40.
* At 70 tokens, the number of questions is approximately 30.
* At 80 tokens, the number of questions is approximately 20.
* At 90 tokens, the number of questions is approximately 15.
* At 100 tokens, the number of questions is approximately 5.
* At 150 tokens, the number of questions is approximately 2.
* At 200 tokens, the number of questions is approximately 1.
* At >200 tokens, the number of questions is approximately 12.
### Key Observations
* Most questions are between 10 and 60 tokens long.
* The number of questions decreases as the question length increases beyond 40 tokens.
* There are relatively few questions longer than 100 tokens.
* There is a small number of questions with more than 200 tokens.
### Interpretation
The data suggests that the majority of questions in the dataset are relatively short, with a peak around 30-40 tokens. The distribution indicates that longer questions are less common. The small spike at ">200" suggests that there is a small subset of questions that are significantly longer than the average. This distribution could be influenced by factors such as the nature of the questions being asked, the writing style of the question askers, or any length constraints imposed on the questions.