## Diagram: Attention Mechanism Flow
### Overview
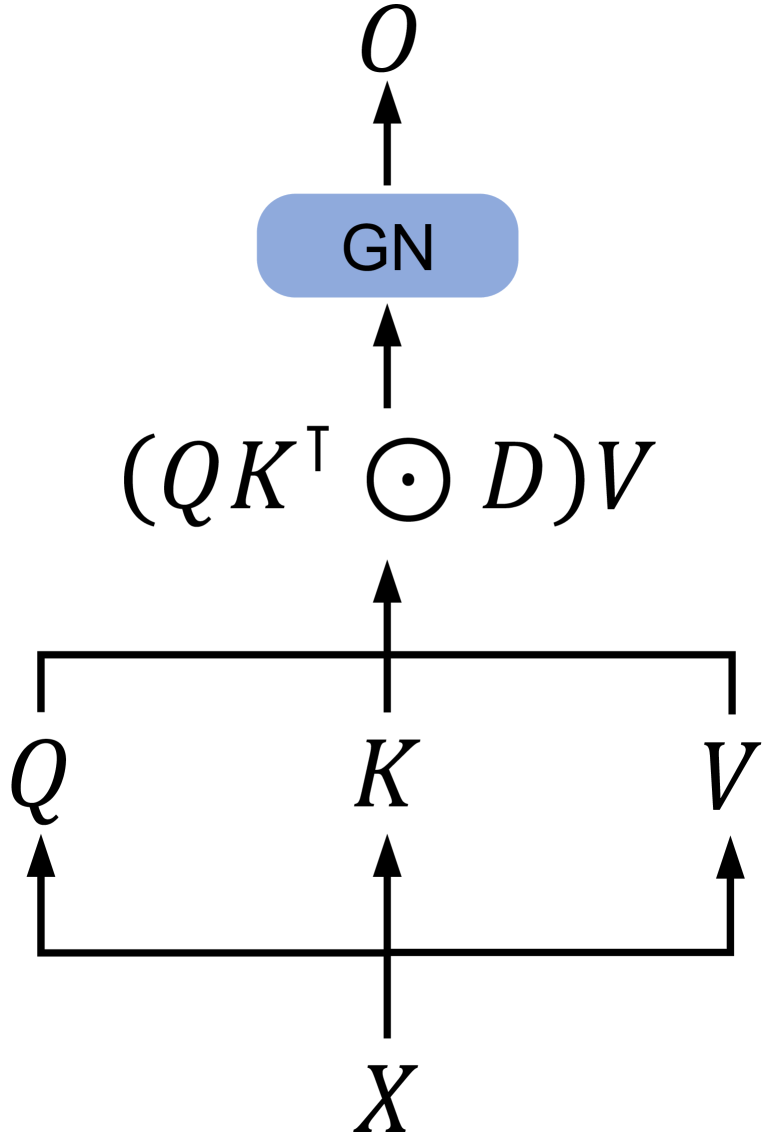
This diagram illustrates a simplified flow of an attention mechanism, likely within a neural network context. It shows how an input `X` is transformed into query (`Q`), key (`K`), and value (`V`) representations, which are then used in a calculation involving matrix multiplication, element-wise multiplication with a diagonal matrix `D`, and finally a transformation by a "GN" module to produce an output `O`.
### Components/Axes
This diagram does not contain axes or legends in the traditional sense of a chart. The components are:
* **Input `X`**: Represented by a single letter 'X' at the bottom, with an arrow pointing upwards, indicating it's the initial input.
* **Query `Q`**: Represented by a single letter 'Q' on the left, with an arrow pointing upwards from a horizontal line originating from `X`.
* **Key `K`**: Represented by a single letter 'K' in the center, with an arrow pointing upwards from a horizontal line originating from `X`.
* **Value `V`**: Represented by a single letter 'V' on the right, with an arrow pointing upwards from a horizontal line originating from `X`.
* **Intermediate Calculation `(QKᵀ ⊙ D)V`**: This is a mathematical expression enclosed in parentheses, indicating a sequence of operations.
* `Q`: Query matrix.
* `Kᵀ`: Transpose of the Key matrix.
* `⊙`: Element-wise multiplication (Hadamard product).
* `D`: A diagonal matrix.
* `V`: Value matrix.
* The entire expression represents the core attention calculation.
* **"GN" Module**: A light blue rounded rectangle containing the text "GN". This likely represents a normalization or a specific layer type (e.g., Group Normalization, Layer Normalization, or a custom module). An arrow points upwards into this module.
* **Output `O`**: Represented by a single letter 'O' at the top, with an arrow pointing upwards from the "GN" module, indicating it's the final output of this process.
### Detailed Analysis or Content Details
The diagram depicts the following flow of operations:
1. An input `X` is processed to generate three distinct representations: `Q`, `K`, and `V`. These are shown as originating from `X` via separate upward arrows, suggesting linear transformations or embeddings.
2. The `Q` and `K` representations are used to compute attention scores. This is indicated by the expression `QKᵀ`.
3. The result of `QKᵀ` is then element-wise multiplied by a diagonal matrix `D`. This step often involves scaling or masking the attention scores. The symbol `⊙` explicitly denotes element-wise multiplication.
4. The result of the element-wise multiplication is then multiplied by the `V` representation. This weighted sum of values forms the output of the attention mechanism.
5. The output of the attention calculation `(QKᵀ ⊙ D)V` is then passed through a module labeled "GN".
6. The "GN" module processes its input and produces the final output `O`.
### Key Observations
* The diagram represents a common pattern in attention mechanisms, particularly in transformer architectures, where queries, keys, and values are derived from an input.
* The inclusion of `D` and the `⊙` operator suggests a mechanism for modifying or masking the attention scores before they are applied to the values. This could be for positional encoding, padding masks, or other forms of attention control.
* The "GN" module indicates a post-attention processing step, likely for stabilization or feature refinement.
### Interpretation
This diagram illustrates a fundamental component of many modern deep learning models, especially in natural language processing and computer vision. The process shown is a form of scaled dot-product attention, potentially with an added masking or scaling factor represented by `D`.
* **What the data suggests or demonstrates**: The diagram demonstrates how an input signal `X` can be decomposed and recombined through a series of matrix operations and a normalization step to produce a contextually aware output `O`. The core idea is that `Q` and `K` determine the "importance" or "attention" of different parts of the input, and these importance weights are then used to aggregate the `V` representations.
* **How the elements relate to each other**:
* `X` is the foundational input from which `Q`, `K`, and `V` are derived.
* `Q` and `K` are used together to compute similarity scores (attention weights).
* `D` modifies these attention weights.
* The modified attention weights are then applied to `V` to create a weighted sum.
* The "GN" module acts as a subsequent processing layer on this weighted sum.
* `O` is the final output after all transformations.
* **Any notable outliers, trends, or anomalies**: The diagram is a schematic representation and does not contain numerical data, so there are no outliers or trends in the data itself. However, the presence of `D` and the `⊙` operator is a notable detail, as it signifies a deviation from the simplest form of scaled dot-product attention (which typically only involves scaling by `sqrt(d_k)`). This suggests a more sophisticated attention mechanism is being depicted. The "GN" module is also a specific choice for post-attention processing, implying a particular architectural design.