\n
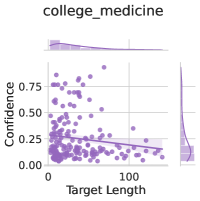
## Scatter Plot: Confidence vs. Target Length (college_medicine)
### Overview
This image presents a scatter plot visualizing the relationship between "Target Length" and "Confidence" for the category "college_medicine". A regression line with a shaded confidence interval is overlaid on the scatter points. The plot suggests a generally negative correlation between target length and confidence.
### Components/Axes
* **Title:** "college\_medicine" (top-center)
* **X-axis:** "Target Length" (bottom-center), ranging from approximately 0 to 120. The axis has tick marks at intervals of 20.
* **Y-axis:** "Confidence" (left-center), ranging from 0.00 to 0.75. The axis has tick marks at intervals of 0.25.
* **Data Points:** Numerous purple dots representing individual data points.
* **Regression Line:** A purple line representing the trend of the data.
* **Confidence Interval:** A shaded purple area around the regression line, indicating the uncertainty in the estimated trend.
### Detailed Analysis
The scatter plot shows a downward trend. As "Target Length" increases, "Confidence" tends to decrease.
* **Data Point Distribution:**
* At Target Length = 0, Confidence values range from approximately 0.15 to 0.75.
* At Target Length = 20, Confidence values range from approximately 0.10 to 0.50.
* At Target Length = 40, Confidence values range from approximately 0.05 to 0.35.
* At Target Length = 60, Confidence values range from approximately 0.05 to 0.25.
* At Target Length = 80, Confidence values range from approximately 0.00 to 0.20.
* At Target Length = 100, Confidence values range from approximately 0.00 to 0.15.
* At Target Length = 120, Confidence values are concentrated around 0.00.
* **Regression Line Trend:** The regression line slopes downward from left to right, confirming the negative correlation.
* **Confidence Interval:** The confidence interval is relatively wide, indicating substantial uncertainty in the estimated relationship. The interval appears to narrow slightly at lower target lengths.
### Key Observations
* The relationship between "Target Length" and "Confidence" is not strictly linear, as evidenced by the scatter of points around the regression line.
* There is a cluster of data points with low confidence values (near 0.00) at higher target lengths.
* The confidence interval is wider at higher target lengths, suggesting that the model is less certain about the confidence values for longer target lengths.
### Interpretation
The data suggests that for the "college\_medicine" category, longer target lengths are associated with lower confidence scores. This could indicate that the model struggles to accurately predict or assess the confidence for longer targets. The wide confidence interval suggests that other factors may also influence confidence, and the relationship between target length and confidence is not deterministic. The negative correlation could be due to several reasons: longer targets might be more complex, ambiguous, or require more specialized knowledge, leading to lower confidence in predictions. The model may be overfitting to shorter targets, resulting in higher confidence scores for those cases. Further investigation is needed to understand the underlying reasons for this relationship and to improve the model's performance on longer targets.