\n
## Line Chart: NMSE vs. Frequency for Different Rooms
### Overview
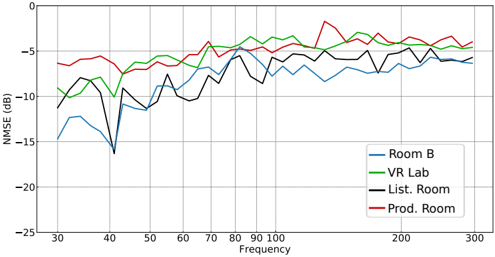
The image presents a line chart comparing the Normalized Mean Squared Error (NMSE) in decibels (dB) across different rooms (Room B, VR Lab, List. Room, and Prod. Room) as a function of frequency, ranging from 30 Hz to 300 Hz. The chart aims to visualize the performance of a system or measurement in each room across the specified frequency spectrum.
### Components/Axes
* **X-axis:** Frequency (Hz), ranging from 30 to 300 Hz, with tick marks every 10 Hz.
* **Y-axis:** NMSE (dB), ranging from -25 dB to 0 dB, with tick marks every 5 dB.
* **Data Series:**
* Room B (Blue Line)
* VR Lab (Green Line)
* List. Room (Black Line)
* Prod. Room (Red Line)
* **Legend:** Located in the top-right corner of the chart, associating each color with a specific room.
### Detailed Analysis
Here's a breakdown of each data series, describing the trend and then extracting approximate data points.
* **Room B (Blue Line):** The line generally fluctuates between approximately -5 dB and -15 dB. It starts at around -16 dB at 30 Hz, dips to approximately -18 dB at 40 Hz, rises to around -8 dB at 60 Hz, then fluctuates between -10 dB and -14 dB until 300 Hz, ending at approximately -12 dB.
* **VR Lab (Green Line):** This line exhibits a more consistent trend, generally staying between -5 dB and -12 dB. It begins at approximately -10 dB at 30 Hz, rises to around -5 dB at 50 Hz, then fluctuates between -7 dB and -12 dB until 300 Hz, ending at approximately -8 dB.
* **List. Room (Black Line):** The black line shows a more erratic pattern, with larger fluctuations. It starts at approximately -6 dB at 30 Hz, dips to around -16 dB at 40 Hz, rises to approximately -4 dB at 80 Hz, then fluctuates between -6 dB and -15 dB until 300 Hz, ending at approximately -5 dB.
* **Prod. Room (Red Line):** This line generally stays between -5 dB and 0 dB. It starts at approximately -3 dB at 30 Hz, dips to around -6 dB at 40 Hz, rises to approximately 0 dB at 100 Hz, then fluctuates between -5 dB and -2 dB until 300 Hz, ending at approximately -3 dB.
### Key Observations
* **Lowest NMSE:** The Prod. Room consistently exhibits the lowest NMSE values across most of the frequency range, indicating the best performance.
* **Highest NMSE:** Room B generally shows the highest NMSE values, suggesting the poorest performance.
* **Frequency Dependence:** All rooms show some degree of frequency dependence, with NMSE values changing as frequency increases.
* **Peak at 100 Hz:** The Prod. Room shows a distinct peak in NMSE around 100 Hz, reaching 0 dB.
* **Initial Dip:** All lines show a dip in NMSE between 30 Hz and 40 Hz.
### Interpretation
The chart suggests that the acoustic environment or measurement setup in the Prod. Room is most favorable for the system being evaluated, as indicated by the consistently lower NMSE values. The VR Lab and List. Room show intermediate performance, while Room B exhibits the highest error. The frequency dependence observed in all rooms suggests that the system's performance is affected by the frequency content of the signal. The peak in NMSE at 100 Hz for the Prod. Room could indicate a resonance or other specific acoustic phenomenon at that frequency. The initial dip in NMSE across all rooms might be related to the system's sensitivity at lower frequencies. This data could be used to optimize the system's performance or to identify rooms that are less suitable for certain applications. Further investigation into the acoustic properties of each room could provide insights into the observed differences in NMSE.