\n
## Heatmap & Scatter Plots: Blind Spot Correlation Analysis
### Overview
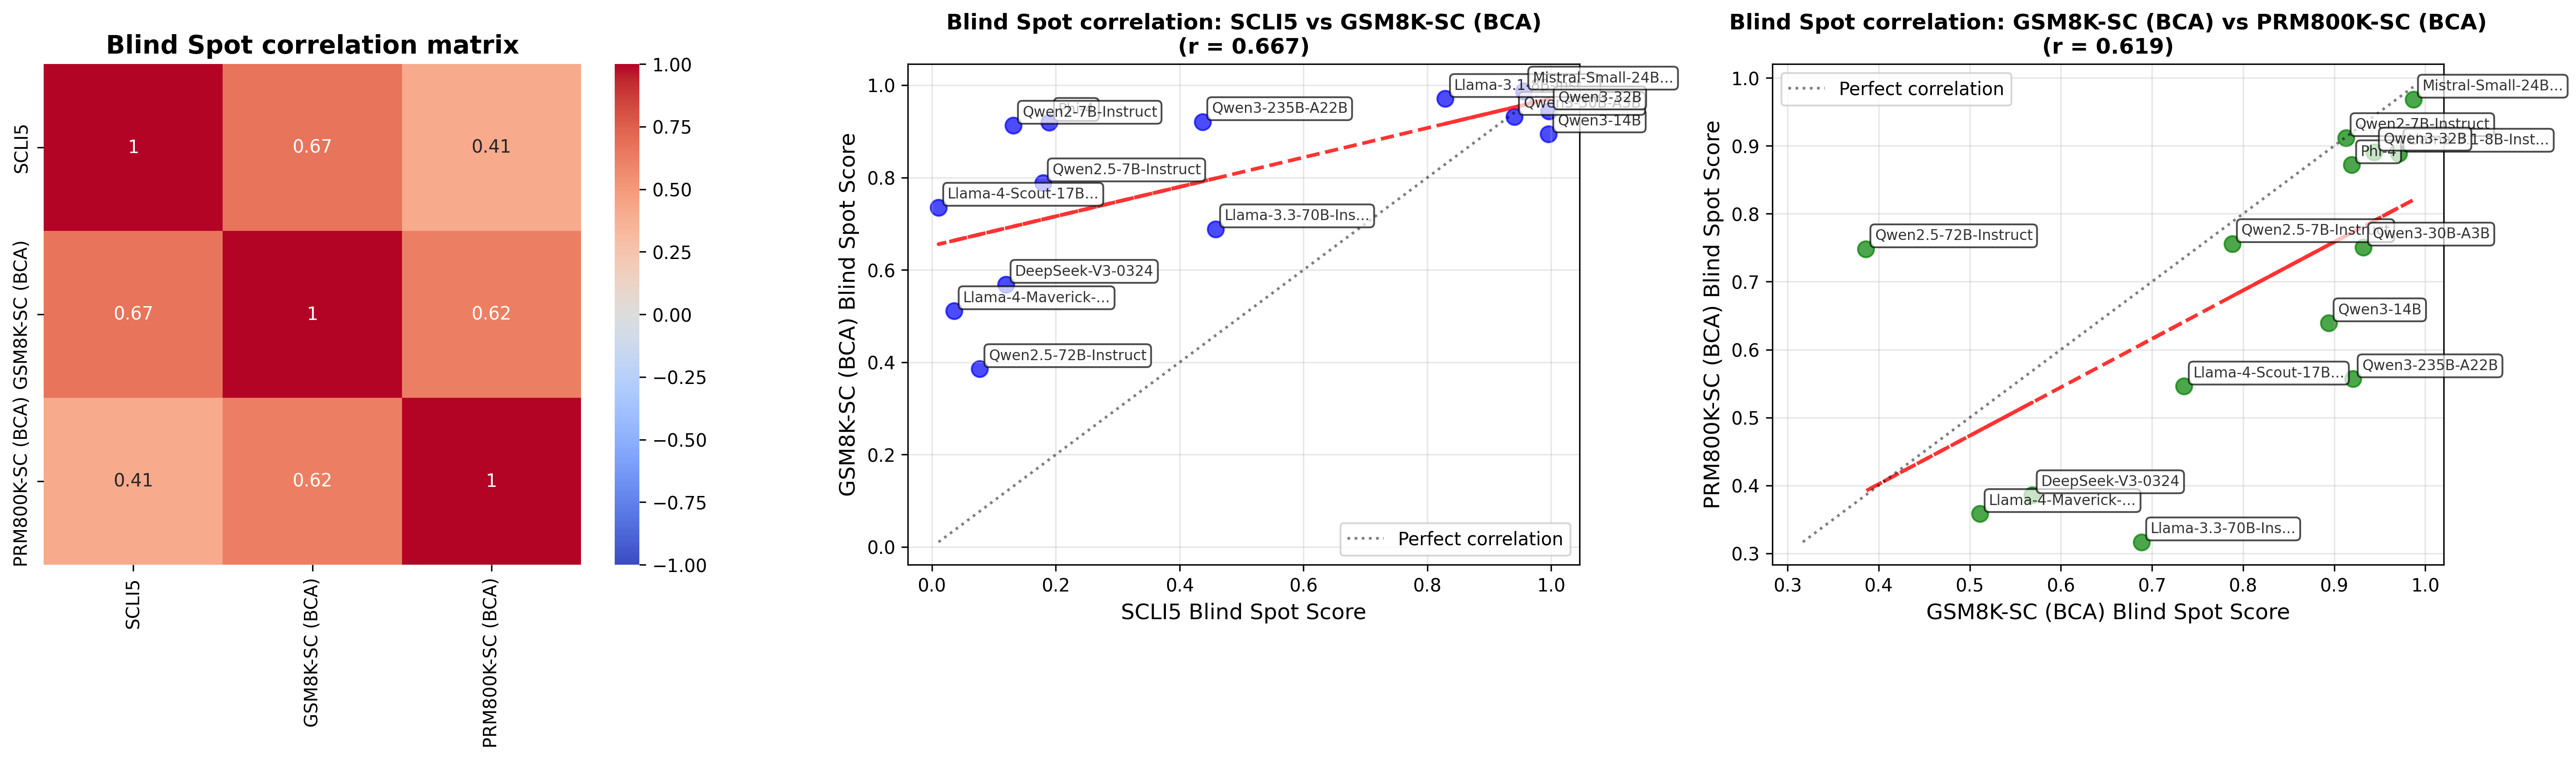
The image presents a correlation analysis of "Blind Spot" scores across different models. It consists of a heatmap showing the correlation matrix between four models (SCLIS, GSM8K-SC, PRM800K-SC, and PRMBOOK-SC), and two scatter plots visualizing the correlation between specific model pairs: SCLIS vs GSM8K-SC, and GSM8K-SC vs PRM800K-SC. Each scatter plot includes labeled data points representing individual models.
### Components/Axes
* **Heatmap:**
* Title: "Blind Spot correlation matrix"
* X-axis: SCLIS, GSM8K-SC (BCA), PRM800K-SC (BCA), PRMBOOK-SC (BCA)
* Y-axis: SCLIS, GSM8K-SC (BCA), PRM800K-SC (BCA), PRMBOOK-SC (BCA)
* Color Scale: Ranges from -1.00 (dark blue) to 1.00 (dark red), with 0.00 represented by white. Values are marked at -0.75, -0.50, -0.25, 0.00, 0.25, 0.50, 0.75, and 1.00.
* **Scatter Plot 1 (SCLIS vs GSM8K-SC):**
* Title: "Blind Spot correlation: SCLIS vs GSM8K-SC (BCA) (r = 0.667)"
* X-axis: SCLIS Blind Spot Score (Scale: 0.0 to 1.0)
* Y-axis: GSM8K-SC (BCA) Blind Spot Score (Scale: 0.0 to 1.0)
* Diagonal Line: "Perfect correlation" (grey dashed line)
* Data Points: Labeled with model names (see "Detailed Analysis" section)
* **Scatter Plot 2 (GSM8K-SC vs PRM800K-SC):**
* Title: "Blind Spot correlation: GSM8K-SC (BCA) vs PRM800K-SC (BCA) (r = 0.619)"
* X-axis: GSM8K-SC (BCA) Blind Spot Score (Scale: 0.0 to 1.0)
* Y-axis: PRM800K-SC (BCA) Blind Spot Score (Scale: 0.3 to 1.0)
* Diagonal Line: "Perfect correlation" (grey dashed line)
* Data Points: Labeled with model names (see "Detailed Analysis" section)
### Detailed Analysis or Content Details
* **Heatmap Values (approximate):**
* SCLIS - SCLIS: 1.00
* SCLIS - GSM8K-SC (BCA): 0.67
* SCLIS - PRM800K-SC (BCA): 0.41
* SCLIS - PRMBOOK-SC (BCA): 0.41
* GSM8K-SC (BCA) - GSM8K-SC (BCA): 1.00
* GSM8K-SC (BCA) - PRM800K-SC (BCA): 0.62
* GSM8K-SC (BCA) - PRMBOOK-SC (BCA): 0.62
* PRM800K-SC (BCA) - PRM800K-SC (BCA): 1.00
* **Scatter Plot 1 (SCLIS vs GSM8K-SC):**
* **Llama-3.3-70B-Instruct:** (0.8, 0.85) - Green
* **Llama-3-8B-Instruct:** (0.9, 0.9) - Green
* **Mistral-Small-32B:** (0.95, 0.95) - Green
* **Qwen2-7B-Instruct:** (0.75, 0.75) - Orange
* **Qwen2-3-256B-A22B:** (0.7, 0.7) - Orange
* **DeepSeek-v3-0324-Llama3-Maven:** (0.4, 0.5) - Blue
* **Qwen2.5-7B-Instruct:** (0.3, 0.3) - Blue
* **Scatter Plot 2 (GSM8K-SC vs PRM800K-SC):**
* **Llama-3.3-70B-Instruct:** (0.8, 0.7) - Green
* **Llama-3-8B-Instruct:** (0.9, 0.8) - Green
* **Mistral-Small-32B:** (0.9, 0.9) - Green
* **Qwen2-7B-Instruct:** (0.7, 0.7) - Orange
* **Qwen2-3-256B-A22B:** (0.7, 0.6) - Orange
* **DeepSeek-v3-0324-Llama3-Maven:** (0.5, 0.5) - Blue
* **Qwen2.5-7B-Instruct:** (0.3, 0.3) - Blue
### Key Observations
* The heatmap shows positive correlations between all model pairs, indicating that higher blind spot scores in one model generally correspond to higher scores in others. The strongest correlation is between SCLIS and itself (1.00), as expected.
* The scatter plots confirm the positive correlations, with points generally clustering around the "Perfect correlation" line.
* The correlation between SCLIS and GSM8K-SC (r=0.667) is slightly stronger than that between GSM8K-SC and PRM800K-SC (r=0.619).
* The models tend to fall into three groups based on their blind spot scores:
* High scores: Llama-3.3-70B-Instruct, Llama-3-8B-Instruct, Mistral-Small-32B
* Medium scores: Qwen2-7B-Instruct, Qwen2-3-256B-A22B
* Low scores: DeepSeek-v3-0324-Llama3-Maven, Qwen2.5-7B-Instruct
### Interpretation
The data suggests that "Blind Spot" is a consistent vulnerability across these language models, though the degree of vulnerability varies. The positive correlations indicate that improvements in reducing blind spots in one model are likely to translate to improvements in others. The grouping of models based on their scores suggests that there may be underlying architectural or training data differences that contribute to varying levels of susceptibility to blind spots. The scatter plots, combined with the correlation coefficients, provide a visual and quantitative assessment of how well the models align in their blind spot profiles. The "Perfect correlation" line serves as a benchmark, and deviations from this line indicate differences in how each model handles blind spot challenges. The fact that all models cluster *around* this line suggests a shared underlying issue, but with varying degrees of severity. The color coding of the data points allows for easy identification of model families and their relative performance.