## Bar Chart: Accuracy of LLM and PRM Combinations
### Overview
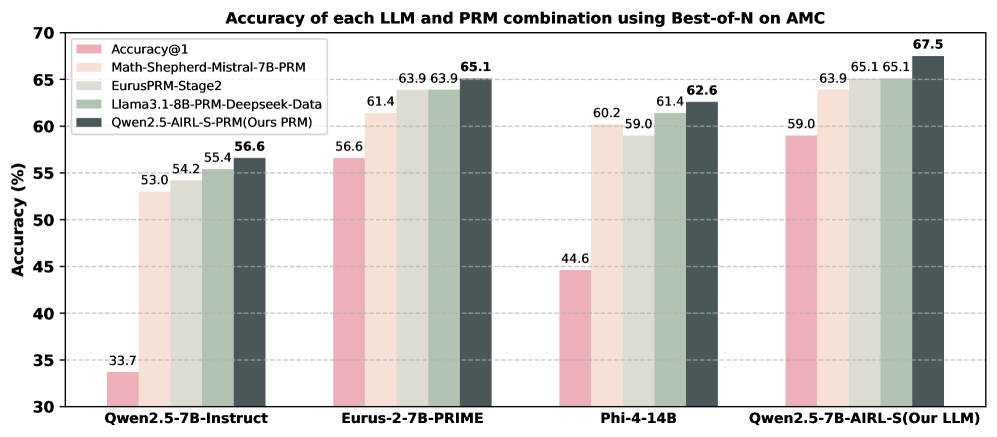
The image is a bar chart comparing the accuracy of different Large Language Model (LLM) and Prompt Relation Model (PRM) combinations using the Best-of-N method on the AMC dataset. The chart displays the accuracy (in percentage) on the y-axis and the LLM/PRM combinations on the x-axis. Each combination has five bars representing different models.
### Components/Axes
* **Title:** Accuracy of each LLM and PRM combination using Best-of-N on AMC
* **Y-axis:** Accuracy (%)
* Scale ranges from 30 to 70, with tick marks at intervals of 5 (30, 35, 40, 45, 50, 55, 60, 65, 70).
* **X-axis:** LLM/PRM Combinations (categorical)
* Qwen2.5-7B-Instruct
* Eurus-2-7B-PRIME
* Phi-4-14B
* Qwen2.5-7B-AIRL-S(Our LLM)
* **Legend:** (Located in the top-left corner)
* Accuracy@1 (Light Pink)
* Math-Shepherd-Mistral-7B-PRM (Light Beige)
* EurusPRM-Stage2 (Light Gray)
* Llama3.1-8B-PRM-Deepseek-Data (Dark Gray-Green)
* Qwen2.5-AIRL-S-PRM (Ours PRM) (Dark Gray)
### Detailed Analysis
The chart presents accuracy scores for each LLM/PRM combination across five different models.
* **Qwen2.5-7B-Instruct:**
* Accuracy@1: 33.7
* Math-Shepherd-Mistral-7B-PRM: 53.0
* EurusPRM-Stage2: 54.2
* Llama3.1-8B-PRM-Deepseek-Data: 55.4
* Qwen2.5-AIRL-S-PRM (Ours PRM): 56.6
* **Eurus-2-7B-PRIME:**
* Accuracy@1: 56.6
* Math-Shepherd-Mistral-7B-PRM: 61.4
* EurusPRM-Stage2: 63.9
* Llama3.1-8B-PRM-Deepseek-Data: 63.9
* Qwen2.5-AIRL-S-PRM (Ours PRM): 65.1
* **Phi-4-14B:**
* Accuracy@1: 44.6
* Math-Shepherd-Mistral-7B-PRM: 60.2
* EurusPRM-Stage2: 59.0
* Llama3.1-8B-PRM-Deepseek-Data: 61.4
* Qwen2.5-AIRL-S-PRM (Ours PRM): 62.6
* **Qwen2.5-7B-AIRL-S(Our LLM):**
* Accuracy@1: 59.0
* Math-Shepherd-Mistral-7B-PRM: 63.9
* EurusPRM-Stage2: 65.1
* Llama3.1-8B-PRM-Deepseek-Data: 65.1
* Qwen2.5-AIRL-S-PRM (Ours PRM): 67.5
### Key Observations
* The "Qwen2.5-AIRL-S-PRM (Ours PRM)" model (dark gray bar) consistently achieves the highest accuracy for each LLM/PRM combination, except for the "Eurus-2-7B-PRIME" combination where it is tied with "Llama3.1-8B-PRM-Deepseek-Data".
* "Accuracy@1" (light pink bar) generally shows the lowest accuracy compared to other models for each LLM/PRM combination.
* The "Qwen2.5-7B-AIRL-S(Our LLM)" combination achieves the highest overall accuracy of 67.5 with the "Qwen2.5-AIRL-S-PRM (Ours PRM)" model.
### Interpretation
The chart demonstrates the performance of different LLM and PRM combinations using the Best-of-N method on the AMC dataset. The results suggest that the "Qwen2.5-AIRL-S-PRM (Ours PRM)" model generally enhances the accuracy of various LLM/PRM combinations. The "Qwen2.5-7B-AIRL-S(Our LLM)" combination, when paired with the "Qwen2.5-AIRL-S-PRM (Ours PRM)" model, yields the highest accuracy among all tested combinations. The "Accuracy@1" model consistently underperforms compared to the other models, indicating that it may not be as effective in this specific context. The data highlights the importance of selecting appropriate models and combinations to optimize accuracy in LLM and PRM tasks.