## Chart: Accuracy vs. Sample Size
### Overview
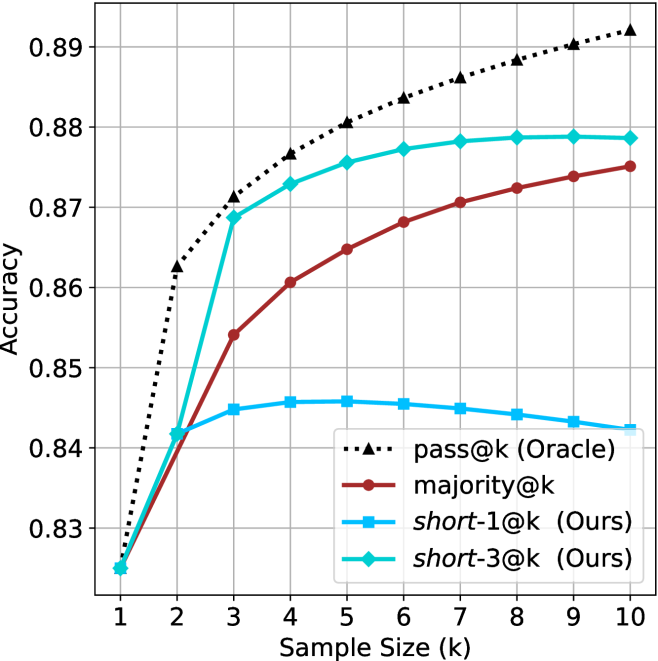
The image is a line chart comparing the accuracy of four different methods ("pass@k (Oracle)", "majority@k", "short-1@k (Ours)", and "short-3@k (Ours)") as a function of sample size (k), which ranges from 1 to 10. The y-axis represents accuracy, ranging from 0.83 to 0.89.
### Components/Axes
* **X-axis:** Sample Size (k), with tick marks at integers from 1 to 10.
* **Y-axis:** Accuracy, with tick marks at 0.83, 0.84, 0.85, 0.86, 0.87, 0.88, and 0.89.
* **Legend:** Located in the bottom-right corner, it identifies the four methods:
* pass@k (Oracle) - black dotted line with triangle markers
* majority@k - brown solid line with circle markers
* short-1@k (Ours) - blue solid line with square markers
* short-3@k (Ours) - cyan solid line with diamond markers
### Detailed Analysis
* **pass@k (Oracle):** (Black dotted line with triangle markers) Starts at approximately 0.825 at k=1, rises sharply to approximately 0.862 at k=2, and continues to increase, but at a decreasing rate, reaching approximately 0.88 at k=6 and approximately 0.891 at k=10.
* **majority@k:** (Brown solid line with circle markers) Starts at approximately 0.825 at k=1, rises to approximately 0.854 at k=3, and continues to increase, but at a decreasing rate, reaching approximately 0.868 at k=5, approximately 0.872 at k=8, and approximately 0.875 at k=10.
* **short-1@k (Ours):** (Blue solid line with square markers) Starts at approximately 0.825 at k=1, rises to approximately 0.843 at k=2, peaks at approximately 0.846 at k=5, and then decreases slightly to approximately 0.844 at k=10.
* **short-3@k (Ours):** (Cyan solid line with diamond markers) Starts at approximately 0.825 at k=1, rises sharply to approximately 0.869 at k=3, and continues to increase, but at a decreasing rate, reaching approximately 0.878 at k=6 and approximately 0.879 at k=10.
### Key Observations
* The "pass@k (Oracle)" method consistently achieves the highest accuracy across all sample sizes.
* The "short-3@k (Ours)" method performs significantly better than "short-1@k (Ours)".
* The accuracy of "short-1@k (Ours)" plateaus and even decreases slightly after a sample size of 5.
* All methods show diminishing returns in accuracy as the sample size increases beyond a certain point.
### Interpretation
The chart demonstrates the relationship between sample size and accuracy for different methods. The "pass@k (Oracle)" method represents an upper bound on performance, likely an ideal or theoretical scenario. The "majority@k" method shows steady improvement with increasing sample size, while the "short-3@k (Ours)" method achieves a good balance between accuracy and sample size. The "short-1@k (Ours)" method appears to suffer from some limitation that prevents it from improving beyond a certain sample size, suggesting a potential overfitting issue or a limitation in the method itself. The diminishing returns observed for all methods suggest that there is a point beyond which increasing the sample size provides little additional benefit in terms of accuracy.