## Line Chart: Accuracy vs. Sample Size (k)
### Overview
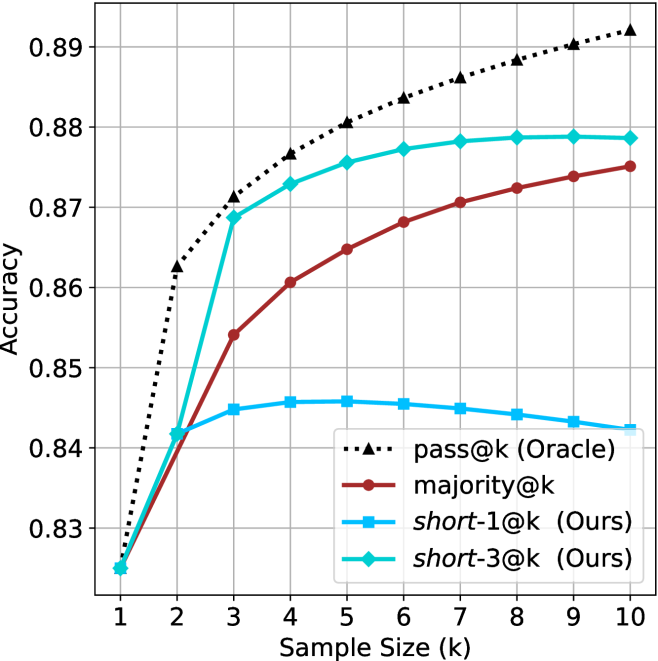
This chart illustrates the performance (Accuracy) of four different sampling methods across varying sample sizes (k), ranging from 1 to 10. The chart demonstrates how accuracy scales as the number of samples increases for each method.
### Components/Axes
* **X-Axis:** Labeled "Sample Size (k)". The scale is linear, marked from 1 to 10.
* **Y-Axis:** Labeled "Accuracy". The scale ranges from 0.83 to 0.89, with grid lines at 0.01 intervals.
* **Legend:** Located in the bottom-right quadrant.
* **pass@k (Oracle):** Black dotted line with triangle markers.
* **majority@k:** Dark red solid line with circle markers.
* **short-1@k (Ours):** Light blue solid line with square markers.
* **short-3@k (Ours):** Teal/Cyan solid line with diamond markers.
### Detailed Analysis
All four data series originate from the same starting point at k=1, with an accuracy of approximately 0.825.
**1. pass@k (Oracle) [Black Dotted Line]**
* **Trend:** Steep, continuous upward slope. It maintains the highest accuracy across all sample sizes.
* **Data Points (Approximate):**
* k=1: 0.825
* k=3: 0.871
* k=5: 0.880
* k=10: 0.892
**2. short-3@k (Ours) [Teal/Cyan Solid Line]**
* **Trend:** Sharp upward slope from k=1 to k=3. After k=3, the slope flattens significantly, approaching a plateau near 0.879.
* **Data Points (Approximate):**
* k=1: 0.825
* k=3: 0.869
* k=5: 0.876
* k=10: 0.879
**3. majority@k [Dark Red Solid Line]**
* **Trend:** Consistent, steady upward slope. It does not plateau as sharply as the "short" methods and continues to improve as k increases.
* **Data Points (Approximate):**
* k=1: 0.825
* k=3: 0.854
* k=5: 0.865
* k=10: 0.875
**4. short-1@k (Ours) [Light Blue Solid Line]**
* **Trend:** Moderate rise until k=4, where it reaches a peak of approximately 0.846. Following k=4, the accuracy exhibits a slight, gradual decline as k increases to 10.
* **Data Points (Approximate):**
* k=1: 0.825
* k=3: 0.845
* k=4: 0.846 (Peak)
* k=10: 0.843
### Key Observations
* **Performance Hierarchy:** The Oracle method consistently outperforms all other methods. Among the "Ours" methods, `short-3@k` significantly outperforms `short-1@k`.
* **Efficiency vs. Scaling:** `short-3@k` is highly efficient at very low sample sizes (k=2 to 3), nearly matching the Oracle. However, it loses ground to the Oracle as k increases.
* **Diminishing Returns/Degradation:** `short-1@k` demonstrates a clear case of diminishing returns, where increasing the sample size beyond 4 actually results in a slight decrease in accuracy, suggesting potential overfitting or the introduction of noise.
### Interpretation
The data suggests that the "Ours" methods are specifically tuned for low-sample-size environments.
* **The "Oracle"** serves as the theoretical upper bound, showing that more samples generally lead to higher accuracy.
* **`short-3@k`** appears to be a highly effective heuristic for small sample sizes (k=3), providing a significant accuracy boost over the `majority@k` baseline without needing a large sample size.
* **`short-1@k`** is likely too restrictive or sensitive; the decline in accuracy after k=4 indicates that for this specific method, more data is detrimental, possibly because the model is forced to incorporate lower-quality samples that degrade the overall result.
* **`majority@k`** is the most stable and reliable method for larger sample sizes, as it continues to improve steadily, unlike the "short" methods which plateau or decline.