## Bar Chart: NMSE Comparison
### Overview
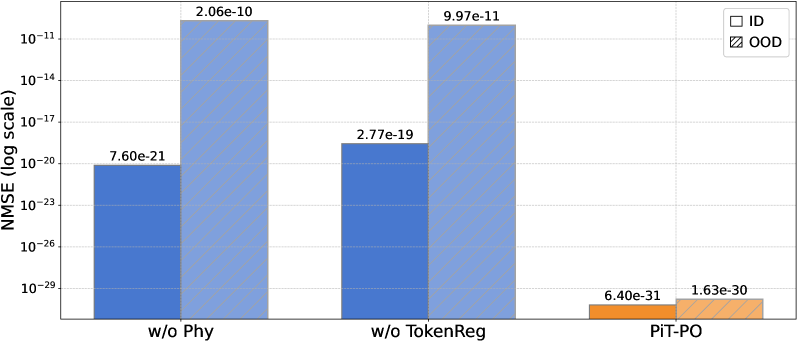
The image is a bar chart comparing the Normalized Mean Squared Error (NMSE) on a logarithmic scale for different methods: "w/o Phy", "w/o TokenReg", and "PiT-PO". The chart compares the NMSE for two conditions: In-Distribution (ID) and Out-of-Distribution (OOD).
### Components/Axes
* **Y-axis:** NMSE (log scale). The y-axis ranges from approximately 10<sup>-29</sup> to 10<sup>-11</sup>, with gridlines at each power of 10.
* **X-axis:** Categorical axis representing the different methods: "w/o Phy", "w/o TokenReg", and "PiT-PO".
* **Legend:** Located in the top-right corner.
* White square: ID (In-Distribution)
* Diagonal lines: OOD (Out-of-Distribution)
* **Bar Colors:**
* ID: Solid blue or orange
* OOD: Light blue or light orange with diagonal lines
### Detailed Analysis
* **w/o Phy:**
* ID (blue): NMSE = 7.60e-21
* OOD (light blue, diagonal lines): NMSE = 2.06e-10
* **w/o TokenReg:**
* ID (blue): NMSE = 2.77e-19
* OOD (light blue, diagonal lines): NMSE = 9.97e-11
* **PiT-PO:**
* ID (orange): NMSE = 6.40e-31
* OOD (light orange, diagonal lines): NMSE = 1.63e-30
### Key Observations
* For "w/o Phy" and "w/o TokenReg", the OOD NMSE is significantly higher than the ID NMSE.
* For "PiT-PO", both ID and OOD NMSE values are very low, close to the bottom of the scale (10<sup>-30</sup> range).
* The NMSE values for PiT-PO are several orders of magnitude lower than the other two methods.
### Interpretation
The chart demonstrates that the "PiT-PO" method significantly outperforms "w/o Phy" and "w/o TokenReg" in terms of NMSE, for both in-distribution and out-of-distribution data. The large difference between ID and OOD NMSE for "w/o Phy" and "w/o TokenReg" suggests that these methods do not generalize well to out-of-distribution data. In contrast, "PiT-PO" maintains a low NMSE even for OOD data, indicating better generalization capabilities.