\n
## Bar Chart: NMSE Comparison of Different Models
### Overview
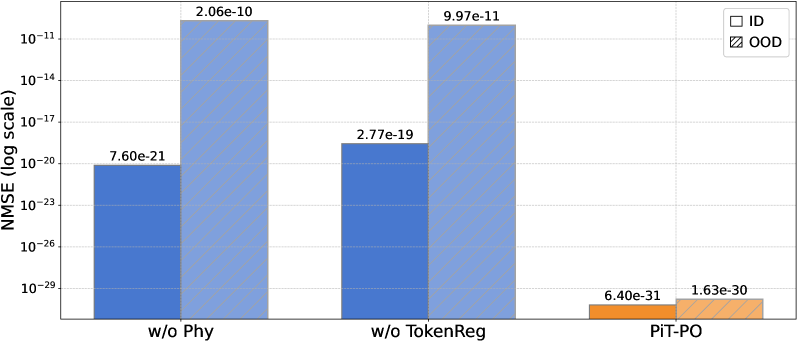
The image presents a bar chart comparing the Normalized Mean Squared Error (NMSE) on a logarithmic scale for three different model configurations: "w/o Phy", "w/o TokenReg", and "PIT-PO". The chart distinguishes between "In-Distribution" (ID) and "Out-of-Distribution" (OOD) data.
### Components/Axes
* **X-axis:** Model Configuration - "w/o Phy", "w/o TokenReg", "PIT-PO"
* **Y-axis:** NMSE (log scale) - ranging from 10^-29 to 10^-10. The scale is logarithmic.
* **Legend:**
* ID (White bars with light gray diagonal pattern)
* OOD (Orange bars with darker orange diagonal pattern)
### Detailed Analysis
The chart displays NMSE values for both In-Distribution (ID) and Out-of-Distribution (OOD) data for each model.
* **w/o Phy:**
* ID: The blue bar representing ID data has a value of approximately 7.60e-21.
* OOD: The blue bar representing OOD data has a value of approximately 2.06e-10.
* **w/o TokenReg:**
* ID: The blue bar representing ID data has a value of approximately 2.77e-19.
* OOD: The blue bar representing OOD data has a value of approximately 9.97e-11.
* **PIT-PO:**
* ID: The orange bar representing ID data has a value of approximately 6.40e-31.
* OOD: The orange bar representing OOD data has a value of approximately 1.63e-30.
The bars for "w/o Phy" and "w/o TokenReg" are blue, indicating the ID and OOD data. The bars for "PIT-PO" are orange, indicating the ID and OOD data.
### Key Observations
* The PIT-PO model consistently exhibits the lowest NMSE values for both ID and OOD data, by several orders of magnitude.
* The NMSE values are significantly higher for OOD data compared to ID data for the "w/o Phy" and "w/o TokenReg" models.
* The difference in NMSE between ID and OOD data is less pronounced for the PIT-PO model.
### Interpretation
The data suggests that the PIT-PO model performs significantly better than the other two configurations ("w/o Phy" and "w/o TokenReg") in terms of minimizing NMSE for both in-distribution and out-of-distribution data. This indicates that the PIT-PO model is more robust and generalizes better to unseen data. The large difference in NMSE between ID and OOD data for the "w/o Phy" and "w/o TokenReg" models suggests that these models are more prone to overfitting or are less capable of handling data that deviates from the training distribution. The smaller difference for PIT-PO suggests better generalization capabilities. The logarithmic scale emphasizes the substantial differences in error rates, particularly the very low errors achieved by PIT-PO. The chart demonstrates the effectiveness of the PIT-PO approach in reducing prediction error, especially when dealing with out-of-distribution data.