## Line Chart: Accuracy vs. Epochs for Three Methods
### Overview
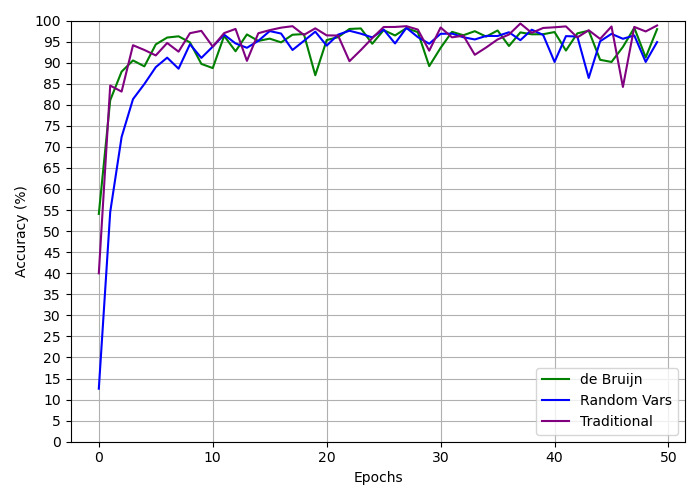
The image is a line chart comparing the training accuracy (in percentage) over 50 epochs for three different methods or models: "de Bruijn", "Random Vars", and "Traditional". All three methods show a rapid initial increase in accuracy followed by a plateau with fluctuations.
### Components/Axes
* **Chart Type:** Line chart with gridlines.
* **X-Axis (Horizontal):**
* **Label:** "Epochs"
* **Scale:** Linear, from 0 to 50.
* **Major Ticks:** 0, 10, 20, 30, 40, 50.
* **Y-Axis (Vertical):**
* **Label:** "Accuracy (%)"
* **Scale:** Linear, from 0 to 100.
* **Major Ticks:** 0, 5, 10, 15, 20, 25, 30, 35, 40, 45, 50, 55, 60, 65, 70, 75, 80, 85, 90, 95, 100.
* **Legend:**
* **Position:** Bottom-right corner of the chart area.
* **Content:**
* Green line: "de Bruijn"
* Blue line: "Random Vars"
* Purple line: "Traditional"
### Detailed Analysis
**Trend Verification & Data Points (Approximate):**
1. **de Bruijn (Green Line):**
* **Trend:** Starts very low, rises extremely steeply to ~85% by epoch 2, then continues a steep but slightly less vertical climb to ~95% by epoch 5. After epoch 5, it plateaus with moderate fluctuations, generally staying between 85% and 98%.
* **Key Points (Approx.):**
* Epoch 0: ~55%
* Epoch 2: ~85%
* Epoch 5: ~95%
* Epoch 10: ~90% (dip)
* Epoch 20: ~95%
* Epoch 30: ~90% (dip)
* Epoch 40: ~97%
* Epoch 50: ~95%
2. **Random Vars (Blue Line):**
* **Trend:** Starts the lowest of all three. Rises steeply but slightly slower than the others initially, reaching ~80% by epoch 3. It continues a strong upward trend, crossing 90% around epoch 7, and then plateaus with fluctuations, often appearing slightly smoother than the other two lines. It generally stays between 85% and 98% after epoch 10.
* **Key Points (Approx.):**
* Epoch 0: ~13%
* Epoch 3: ~80%
* Epoch 7: ~90%
* Epoch 10: ~93%
* Epoch 20: ~96%
* Epoch 30: ~97%
* Epoch 40: ~95%
* Epoch 50: ~93%
3. **Traditional (Purple Line):**
* **Trend:** Starts at a moderate level. Rises very steeply, similar to de Bruijn, reaching ~84% by epoch 1 and ~94% by epoch 3. It then enters a high plateau with the most pronounced and frequent fluctuations of the three lines, oscillating sharply between approximately 84% and 99%.
* **Key Points (Approx.):**
* Epoch 0: ~40%
* Epoch 1: ~84%
* Epoch 3: ~94%
* Epoch 5: ~97%
* Epoch 10: ~93% (dip)
* Epoch 20: ~98%
* Epoch 30: ~98%
* Epoch 40: ~98%
* Epoch 45: ~84% (significant dip)
* Epoch 50: ~98%
### Key Observations
1. **Convergence:** All three methods converge to a high accuracy range (roughly 85-99%) after the initial training phase (approximately after epoch 10).
2. **Initial Learning Speed:** "de Bruijn" and "Traditional" methods learn faster in the very first few epochs compared to "Random Vars".
3. **Stability:** The "Random Vars" (blue) line appears to have the smoothest plateau with slightly less volatility after convergence. The "Traditional" (purple) line exhibits the most dramatic short-term fluctuations, including a notable sharp dip around epoch 45.
4. **Final Performance:** At epoch 50, the "Traditional" and "de Bruijn" methods appear to end at a slightly higher accuracy (~95-98%) than "Random Vars" (~93%), though all are within a close range.
### Interpretation
This chart demonstrates a comparative analysis of training efficiency and stability for three algorithmic approaches. The data suggests:
* **Effectiveness:** All three methods are effective for the given task, as they all achieve high accuracy (>90%).
* **Trade-offs:** There appears to be a trade-off between initial learning speed and training stability. The "Traditional" method learns very quickly but exhibits high variance during training, which might indicate sensitivity to batch data or a more aggressive optimization landscape. The "Random Vars" method learns slightly slower initially but offers more stable convergence, which could be preferable for reliable training.
* **Robustness:** The "de Bruijn" method offers a balance, with fast initial learning and moderate stability. The significant dip in the "Traditional" line around epoch 45 is an anomaly that warrants investigation—it could represent a problematic mini-batch, an instability in the learning rate, or a characteristic of the optimization path for that method.
* **Underlying Message:** The chart likely aims to show that while novel methods ("de Bruijn", "Random Vars") are competitive with or offer different stability profiles compared to a "Traditional" baseline, no single method is strictly superior across all metrics (speed, final accuracy, stability). The choice would depend on the specific priorities of the training process (e.g., speed vs. reliability).