## Diagram: Input-Output Grid Transformation
### Overview
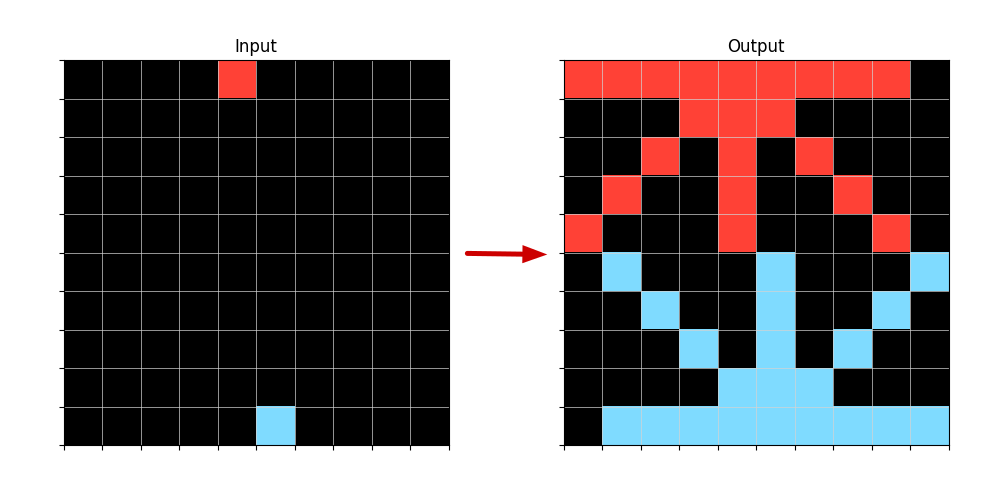
The image displays a technical diagram illustrating a transformation process between two 10x10 grids. The left grid is labeled "Input" and contains two isolated colored cells on a black background. A red arrow points from the Input grid to the right grid, labeled "Output," which shows a complex, symmetrical pattern generated from the initial colored cells. The diagram visually demonstrates an algorithm or process that expands single points into structured patterns.
### Components/Axes
* **Titles:** "Input" (centered above the left grid), "Output" (centered above the right grid).
* **Grids:** Two 10x10 square grids. Each grid is composed of 100 individual cells.
* **Arrow:** A solid red arrow (`→`) positioned between the two grids, indicating the direction of transformation from Input to Output.
* **Color Legend (Implied):**
* **Black:** Background/empty cell.
* **Red:** Active cell (Input: single point; Output: forms an upper pattern).
* **Light Blue/Cyan:** Active cell (Input: single point; Output: forms a lower pattern).
### Detailed Analysis
**Input Grid (Left):**
* **Dimensions:** 10 rows x 10 columns.
* **Content:** 98 black cells, 2 colored cells.
* **Red Cell Position:** Row 1, Column 5 (counting from top-left, 1-based index).
* **Light Blue Cell Position:** Row 10, Column 5.
**Output Grid (Right):**
* **Dimensions:** 10 rows x 10 columns.
* **Content:** A symmetrical pattern of red and light blue cells on a black background. The pattern is vertically mirrored around the central column (Column 5/6).
* **Red Pattern (Upper Half):** Forms a shape resembling a stylized tree, arrow, or fountain. It originates from the top edge and expands downward and outward.
* **Row 1:** Columns 1-8 are red.
* **Row 2:** Columns 4-7 are red.
* **Row 3:** Columns 3, 5, 8 are red.
* **Row 4:** Columns 2, 6, 9 are red.
* **Row 5:** Columns 1, 5, 10 are red.
* **Light Blue Pattern (Lower Half):** Forms a shape resembling a fountain, anchor, or inverted tree. It originates from the bottom edge and expands upward and outward.
* **Row 6:** Columns 2, 5, 10 are light blue.
* **Row 7:** Columns 3, 8 are light blue.
* **Row 8:** Columns 4, 7 are light blue.
* **Row 9:** Columns 5, 6 are light blue.
* **Row 10:** Columns 2-9 are light blue.
* **Black Cells:** Fill all positions not occupied by red or light blue cells.
### Key Observations
1. **Symmetry:** The output pattern exhibits near-perfect vertical symmetry. The left half (Columns 1-5) is a mirror image of the right half (Columns 6-10).
2. **Origin Points:** The red pattern expands downward from the top edge (Row 1), while the light blue pattern expands upward from the bottom edge (Row 10). This corresponds to the vertical positions of the single red and blue cells in the Input grid.
3. **Pattern Logic:** The transformation appears to follow a rule-based expansion, possibly a cellular automaton, a flood-fill algorithm with constraints, or a procedural generation rule. The patterns do not overlap; red and blue cells remain distinct.
4. **Density:** The Input is extremely sparse (2% filled). The Output is significantly denser, with 38 colored cells (38% filled).
### Interpretation
This diagram is a visual proof-of-concept for a generative algorithm. It demonstrates how minimal input—two single pixels—can be transformed into a complex, ordered, and symmetrical output through a deterministic process.
* **What it Suggests:** The process likely simulates concepts like diffusion, growth, or signal propagation from source points. The symmetry implies the application of a consistent rule applied equally in left/right directions. The separation of colors suggests the algorithm treats different "materials" or "signals" independently.
* **Relationships:** The Input defines the seed locations and colors. The Output is the result of applying a transformation function to those seeds over multiple iterations or steps. The arrow is the visual representation of that function.
* **Notable Anomalies:** The patterns are perfectly contained within the grid and do not bleed into each other, indicating a rule that prevents mixing or collision. The output is not a simple geometric expansion (like a circle) but a more intricate, branching structure, hinting at a rule with specific directional biases or conditions.
**In essence, the image documents a computational experiment where simple starting conditions yield complex, aesthetically structured results, highlighting the power of algorithmic generation.**