## Line Chart: Validation Loss vs FLOPs Across Model Configurations
### Overview
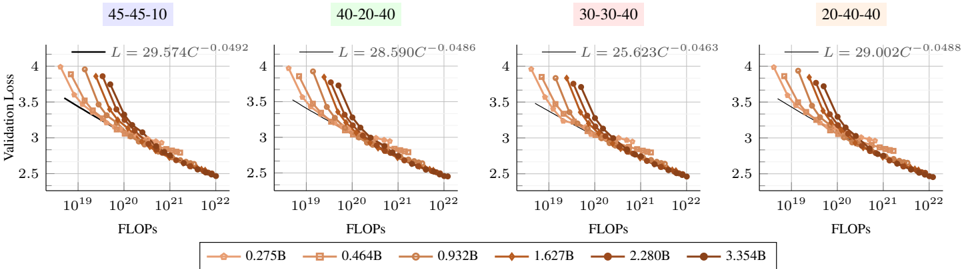
The image contains four line charts arranged horizontally, each representing a different model configuration (45-45-10, 40-20-40, 30-30-40, 20-40-40). All charts plot validation loss against FLOPs (floating-point operations) on a logarithmic scale. Each subplot includes a fitted power-law curve and data points with error bars representing different model sizes (0.275B to 3.354B parameters).
### Components/Axes
- **X-axis**: FLOPs (log scale, 10¹⁹ to 10²²)
- **Y-axis**: Validation Loss (linear scale, 2.5 to 4)
- **Legend**: Located at bottom center, mapping model sizes (0.275B, 0.464B, 0.932B, 1.627B, 2.280B, 3.354B) to colors (orange to dark red)
- **Subplot Titles**: Positioned above each chart in colored boxes (e.g., "45-45-10" in light blue)
- **Fitted Curves**: Black lines with equations of the form `L = C * FLOPs^(-k)` and R² values (~0.99)
### Detailed Analysis
1. **45-45-10 Configuration**
- Equation: `L = 29.574C⁻⁰.⁰⁴⁹²` (R² ≈ 0.99)
- Data points: Orange (0.275B), Red (0.464B), Brown (0.932B)
- Trend: Validation loss decreases with increasing FLOPs, with larger models showing steeper declines
2. **40-20-40 Configuration**
- Equation: `L = 28.590C⁻⁰.⁰⁴⁸⁶` (R² ≈ 0.99)
- Data points: Orange (0.275B), Red (0.464B), Brown (0.932B)
- Trend: Similar to 45-45-10 but with slightly higher baseline loss
3. **30-30-40 Configuration**
- Equation: `L = 25.623C⁻⁰.⁰⁴⁶³` (R² ≈ 0.99)
- Data points: Orange (1.627B), Red (2.280B), Brown (3.354B)
- Trend: Strongest negative exponent (-0.0463), indicating most efficient scaling
4. **20-40-40 Configuration**
- Equation: `L = 29.002C⁻⁰.⁰⁴⁸⁸` (R² ≈ 0.99)
- Data points: Orange (1.627B), Red (2.280B), Brown (3.354B)
- Trend: Similar to 40-20-40 but with higher baseline loss
### Key Observations
- All configurations show **power-law scaling** with negative exponents between -0.046 and -0.049
- Larger models (3.354B) consistently achieve lower validation loss at equivalent FLOPs
- The 30-30-40 configuration demonstrates the most efficient scaling (steepest slope)
- Error bars suggest measurement uncertainty decreases with higher FLOPs
- All R² values exceed 0.99, indicating strong correlation between FLOPs and validation loss
### Interpretation
The charts demonstrate that model performance improves predictably with computational resources across all configurations, following a near-linear relationship on a log-log scale. The 30-30-40 architecture achieves the best performance per FLOP, suggesting architectural efficiency plays a critical role. The consistent R² values across all plots indicate that the power-law relationship is robust across different model sizes and configurations. This suggests that while larger models require more resources, their performance gains follow a mathematically predictable pattern, enabling capacity planning for training infrastructure.