## Line Chart: Model Accuracy on Math Problems
### Overview
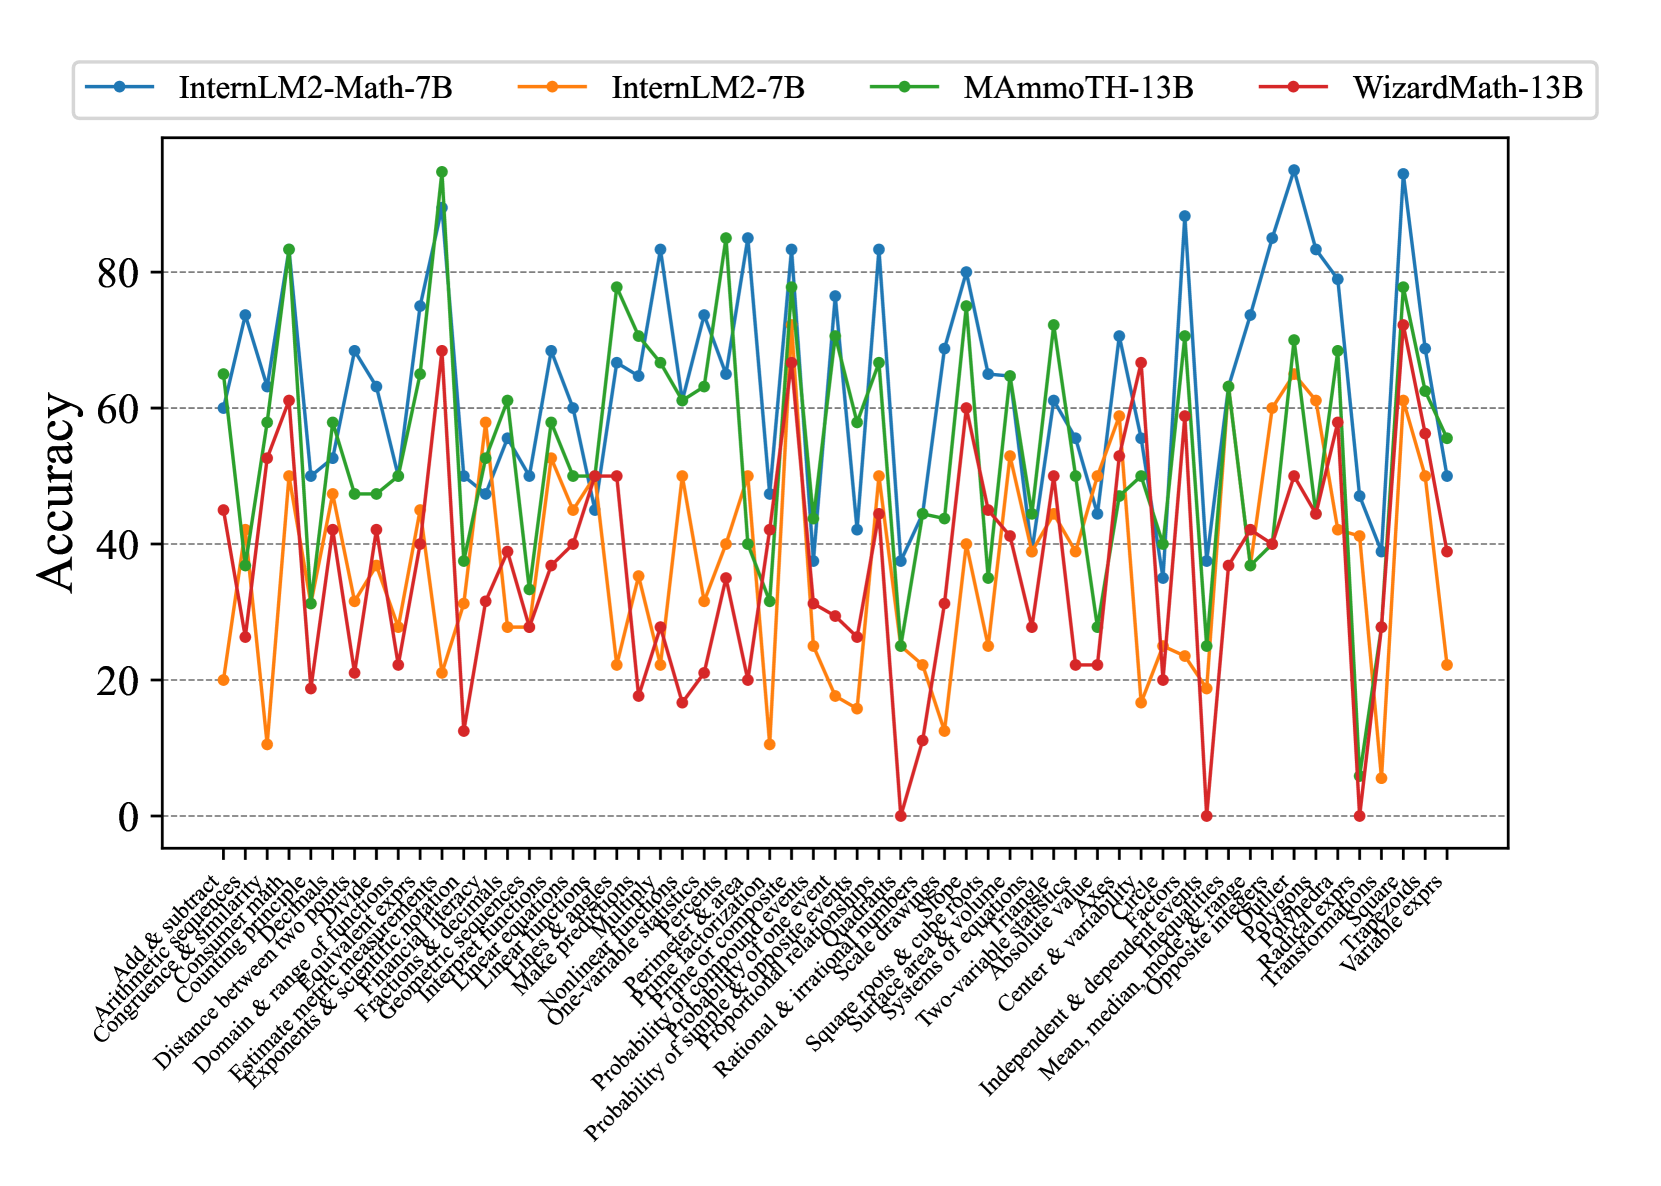
The image is a line chart comparing the accuracy of four different language models (InternLM2-Math-7B, InternLM2-7B, MAmmoTH-13B, and WizardMath-13B) on a variety of math problem types. The x-axis represents different math topics, and the y-axis represents accuracy, ranging from 0 to 80.
### Components/Axes
* **Title:** There is no explicit title on the chart.
* **X-axis:** Represents different math problem types. The labels are densely packed and rotated for readability. The labels include:
* Add & subtract
* Arithmetic sequences
* Congruence & similarity
* Consumer math
* Counting Principles
* Distance between two points
* Domain & range of functions
* Estimate metric measurements
* Exponents & scientific notation
* Financial literacy
* Fractions & decimals
* Geometric shapes
* Interpret functions
* Linear equations
* Linear functions
* Lines & angles
* Make predictions
* Nonlinear functions
* One-variable statistics
* Perimeter & area
* Prime factorization
* Prime or composite
* Probability of compound events
* Probability of one event
* Probability of simple & opposite events
* Quadrants
* Rational & irrational numbers
* Scale drawings
* Slope
* Square roots & cube roots
* Surface area & volume
* Systems of equations
* Two-variable statistics
* Absolute value
* Center & variability
* Circle
* Factors
* Independent & dependent events
* Inequalities
* Mean, median, mode, & range
* Opposite integers
* Outlier
* Polygons
* Polyhedra
* Radical exprs
* Square
* Transformations
* Trapezoids
* Variable exprs
* Axes
* **Y-axis:** Represents accuracy, labeled "Accuracy". The scale ranges from 0 to 80, with tick marks at intervals of 20.
* **Legend:** Located at the top of the chart.
* Blue: InternLM2-Math-7B
* Orange: InternLM2-7B
* Green: MAmmoTH-13B
* Red: WizardMath-13B
* **Gridlines:** Horizontal dashed lines at each 20-unit interval on the y-axis.
### Detailed Analysis
The chart displays the accuracy of four language models across a range of math problem types. Each model's performance is represented by a colored line.
* **InternLM2-Math-7B (Blue):** This model generally shows high accuracy, often outperforming the other models. The trend is highly variable, with peaks and valleys across different problem types.
* **InternLM2-7B (Orange):** This model generally shows lower accuracy compared to InternLM2-Math-7B and MAmmoTH-13B. The trend is also highly variable.
* **MAmmoTH-13B (Green):** This model shows relatively high accuracy, often comparable to InternLM2-Math-7B. The trend is variable.
* **WizardMath-13B (Red):** This model generally shows lower accuracy compared to InternLM2-Math-7B and MAmmoTH-13B, but sometimes outperforms InternLM2-7B. The trend is highly variable.
**Specific Data Points (Approximate):**
It's difficult to provide precise data points due to the density of the chart, but here are some approximate values for a few problem types:
* **Add & subtract:**
* InternLM2-Math-7B (Blue): ~65
* InternLM2-7B (Orange): ~20
* MAmmoTH-13B (Green): ~65
* WizardMath-13B (Red): ~45
* **Counting Principles:**
* InternLM2-Math-7B (Blue): ~60
* InternLM2-7B (Orange): ~40
* MAmmoTH-13B (Green): ~80
* WizardMath-13B (Red): ~55
* **Prime Factorization:**
* InternLM2-Math-7B (Blue): ~80
* InternLM2-7B (Orange): ~55
* MAmmoTH-13B (Green): ~50
* WizardMath-13B (Red): ~55
* **Axes:**
* InternLM2-Math-7B (Blue): ~85
* InternLM2-7B (Orange): ~30
* MAmmoTH-13B (Green): ~30
* WizardMath-13B (Red): ~50
### Key Observations
* InternLM2-Math-7B (Blue) generally performs the best, achieving the highest accuracy on many problem types.
* InternLM2-7B (Orange) generally performs the worst.
* The performance of all models varies significantly depending on the problem type.
* There are some problem types where all models perform poorly (e.g., near "Rational & irrational numbers").
* There are some problem types where all models perform well (e.g., near "Prime Factorization").
### Interpretation
The chart provides a comparative analysis of the accuracy of four language models on a diverse set of math problems. The data suggests that the InternLM2-Math-7B model is generally the most accurate, while InternLM2-7B is the least accurate. However, the performance of each model is highly dependent on the specific type of math problem. This indicates that different models may have different strengths and weaknesses in their mathematical reasoning abilities. The variability in performance across problem types highlights the complexity of mathematical reasoning and the challenges in developing models that can consistently solve a wide range of math problems. The chart could be used to identify areas where each model needs improvement and to guide the development of more robust and versatile mathematical reasoning systems.