\n
## Diagram: 8-Way Visual Raven's Progressive Matrix (RPM) Process
### Overview
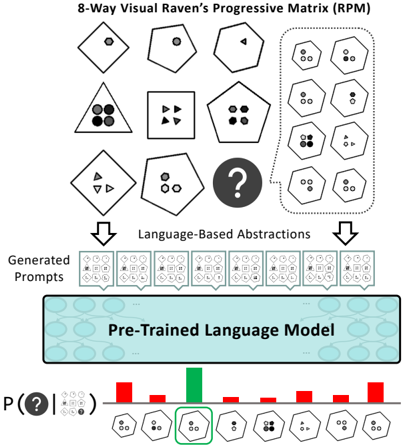
The image depicts a diagram illustrating the process of solving an 8-Way Visual Raven's Progressive Matrix (RPM) using a pre-trained language model. The process involves generating language-based abstractions from the visual matrix and then using these abstractions to predict the missing element. The diagram shows the input RPM, the generated prompts, the language model, and the probability distribution over possible answers.
### Components/Axes
The diagram is structured into four main sections:
1. **8-Way Visual Raven's Progressive Matrix (RPM):** A 3x3 grid of shapes with one missing element, marked with a question mark.
2. **Language-Based Abstractions:** A row of small grids representing the generated prompts from the RPM.
3. **Pre-Trained Language Model:** A large, light-blue rectangular block representing the language model. It is depicted as a network of interconnected nodes.
4. **Probability Distribution:** A bar chart showing the probability of each possible answer being the correct one. The x-axis represents the possible answers (each depicted as a small RPM element), and the y-axis represents the probability P(? | …).
### Detailed Analysis or Content Details
**1. 8-Way Visual Raven's Progressive Matrix (RPM):**
The RPM consists of 8 shapes (a diamond, hexagon, triangle, square, and variations of these) arranged in a 3x3 grid with the bottom-right cell missing. The shapes contain varying numbers of filled circles.
**2. Language-Based Abstractions:**
Below the RPM, there is a row of 8 small grids, each representing a language-based abstraction of one of the RPM elements. These abstractions appear to be visual representations of the shapes and their features.
**3. Pre-Trained Language Model:**
The language model is a large, light-blue rectangle with a network of interconnected nodes inside. This visually represents the complexity of the model.
**4. Probability Distribution:**
The bar chart at the bottom shows the probability distribution over the possible answers. The x-axis displays the 8 possible answer choices, each represented by a small RPM element. The y-axis is labeled "P(? | …)", representing the probability of each answer being the correct one given the context.
- The first 7 bars are red and relatively short, indicating low probability.
- The 8th bar is green and significantly taller, indicating a high probability.
- The height of the red bars is approximately 0.1-0.2 (estimated).
- The height of the green bar is approximately 0.6-0.8 (estimated).
### Key Observations
- The language model assigns a significantly higher probability to one of the possible answers compared to the others.
- The visual representation of the language model suggests a complex network.
- The diagram illustrates a pipeline from visual input (RPM) to language abstraction to probabilistic prediction.
### Interpretation
This diagram demonstrates a method for solving visual reasoning problems (like RPMs) using a pre-trained language model. The process involves translating the visual information into a language-based representation that the model can understand and reason about. The model then uses this representation to predict the missing element in the RPM, outputting a probability distribution over the possible answers. The high probability assigned to one answer suggests that the model has successfully identified the underlying pattern in the RPM. The use of a pre-trained language model indicates that the model leverages prior knowledge to solve the problem, rather than learning from scratch. This approach highlights the potential of combining visual and linguistic reasoning for solving complex cognitive tasks. The diagram is a conceptual illustration of the process, rather than a presentation of specific data or results. It is a visual explanation of a methodology.