## Scatter Plot: Language Model Benchmark Performance vs. Parameter Size
### Overview
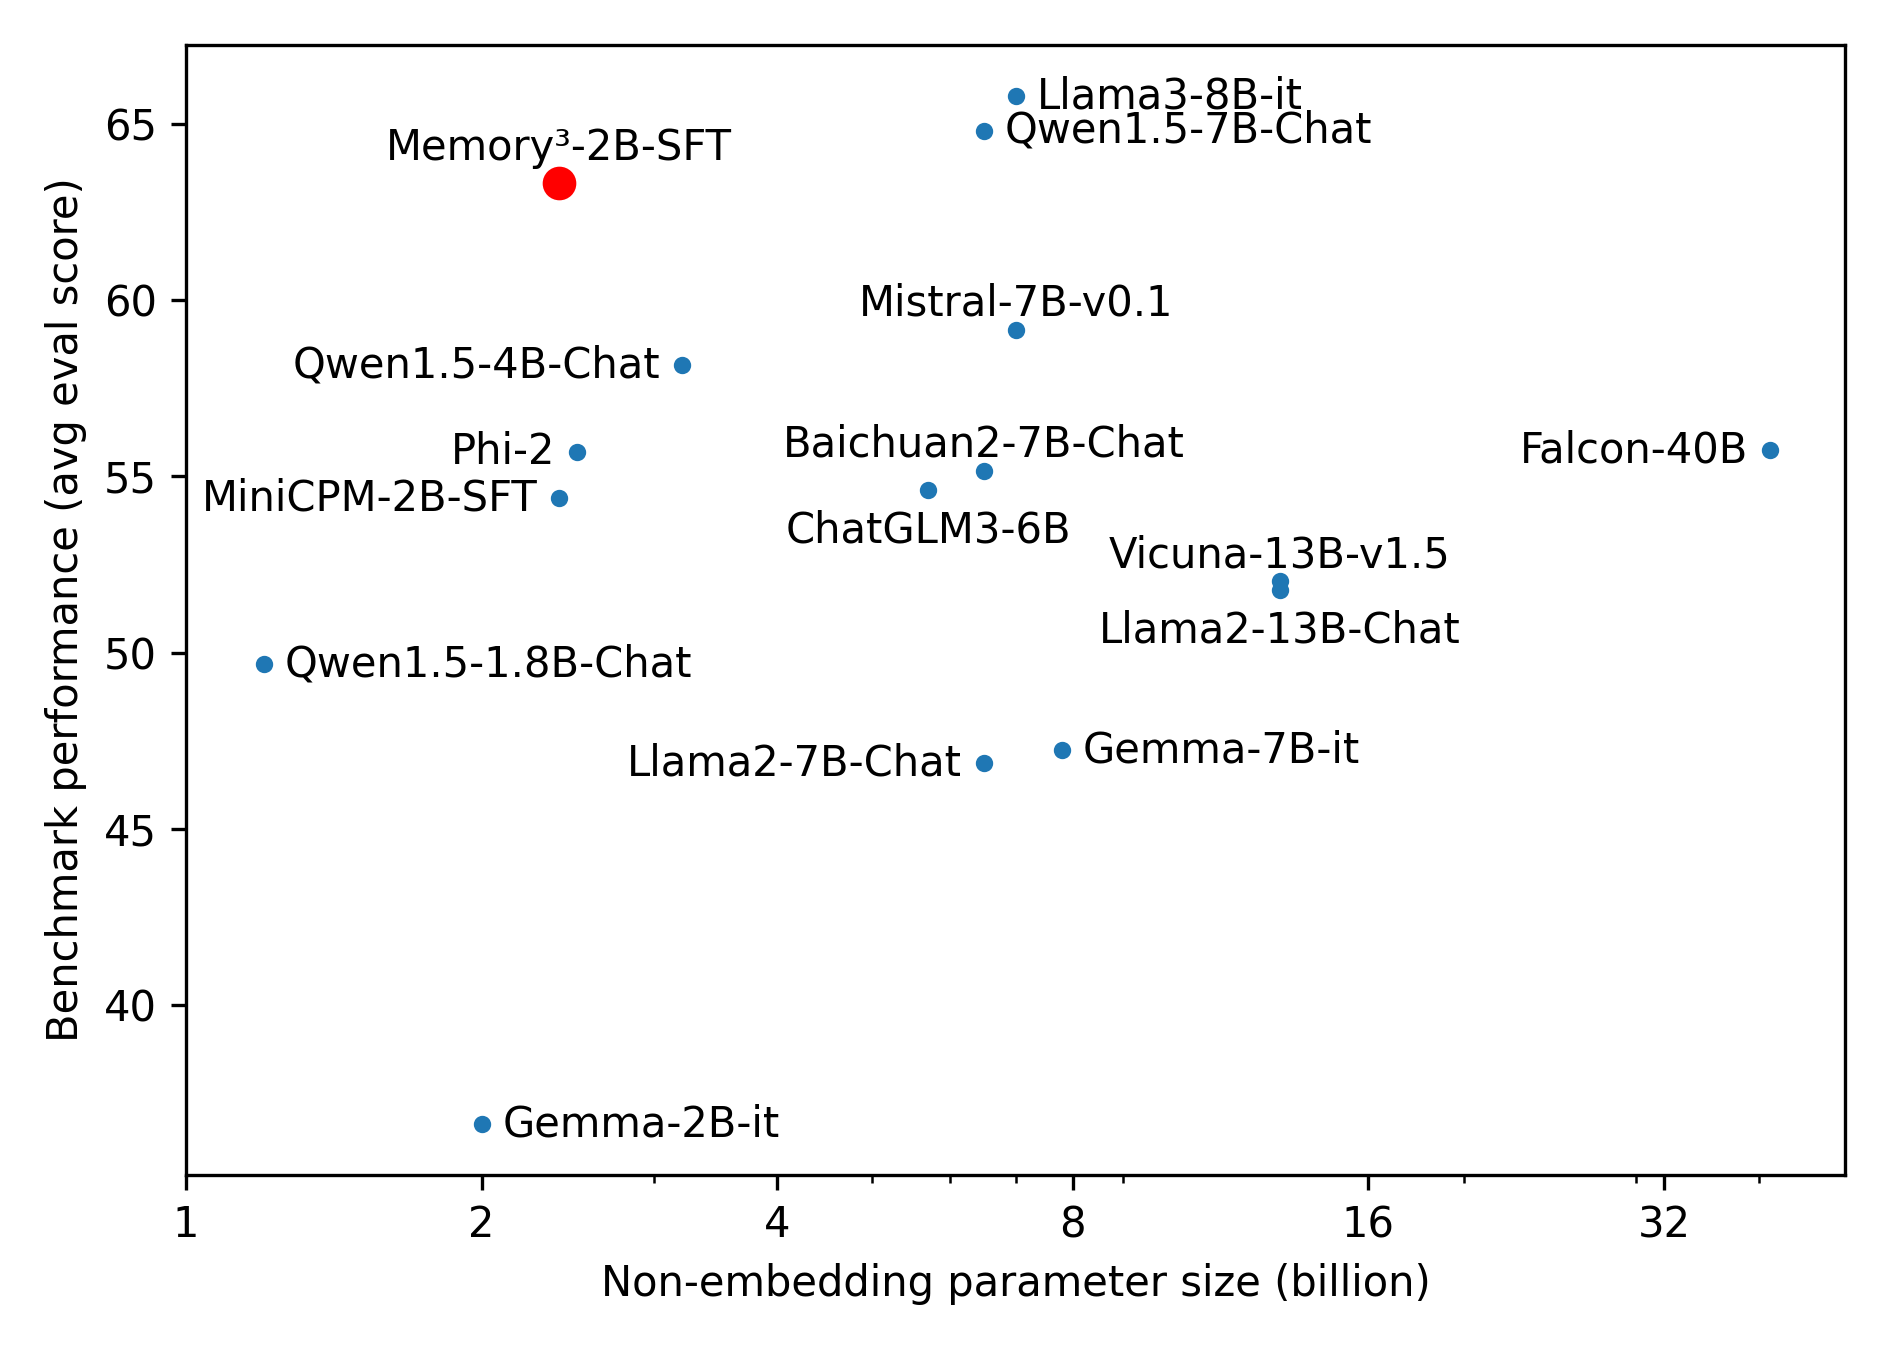
This image is a scatter plot comparing various large language models (LLMs) based on two metrics: their non-embedding parameter size (in billions) and their average benchmark evaluation score. The plot visually demonstrates the relationship between model scale and performance, highlighting one specific model in red for emphasis.
### Components/Axes
* **Chart Type:** Scatter Plot
* **X-Axis:** "Non-embedding parameter size (billion)". The scale is logarithmic, with major tick marks at 1, 2, 4, 8, 16, and 32 billion parameters.
* **Y-Axis:** "Benchmark performance (avg eval score)". The scale is linear, ranging from approximately 35 to 67, with major tick marks every 5 units from 40 to 65.
* **Data Points:** Each point represents a specific language model, labeled with its name. The points are colored either blue or red.
* **Legend/Key:** There is no separate legend box. The color coding is implicit: one model is red, all others are blue. The red point is explicitly labeled "Memory³-2B-SFT".
### Detailed Analysis
The plot contains 15 labeled data points. Below is a list of each model with its approximate coordinates (Parameter Size, Performance Score). Values are estimated based on the logarithmic x-axis and linear y-axis.
**Models (Blue Points):**
1. **Gemma-2B-it:** (~2B, ~37)
2. **Qwen1.5-1.8B-Chat:** (~1.8B, ~50)
3. **MiniCPM-2B-SFT:** (~2B, ~54.5)
4. **Phi-2:** (~2.7B, ~55.5)
5. **Qwen1.5-4B-Chat:** (~4B, ~58)
6. **Llama2-7B-Chat:** (~7B, ~47)
7. **ChatGLM3-6B:** (~6B, ~54.5)
8. **Baichuan2-7B-Chat:** (~7B, ~55)
9. **Gemma-7B-it:** (~8B, ~47.5)
10. **Mistral-7B-v0.1:** (~7B, ~59)
11. **Qwen1.5-7B-Chat:** (~7.5B, ~65)
12. **Llama3-8B-it:** (~8B, ~66)
13. **Vicuna-13B-v1.5:** (~13B, ~52)
14. **Llama2-13B-Chat:** (~13B, ~51.5)
15. **Falcon-40B:** (~40B, ~55.5)
**Model (Red Point):**
16. **Memory³-2B-SFT:** (~2.5B, ~63.5) - This point is located in the upper-left quadrant of the plot, significantly higher on the y-axis than other models of similar or larger size.
### Key Observations
* **Performance Range:** Benchmark scores range from a low of ~37 (Gemma-2B-it) to a high of ~66 (Llama3-8B-it).
* **Parameter Size Range:** Models span from ~1.8B to ~40B non-embedding parameters.
* **General Trend:** There is a loose positive correlation; models with more parameters generally achieve higher benchmark scores. However, there is significant variance. For example, models around 7-8B parameters have scores ranging from ~47 (Llama2-7B-Chat) to ~66 (Llama3-8B-it).
* **Notable Outlier:** The red-highlighted model, **Memory³-2B-SFT**, is a major outlier. With only ~2.5B parameters, it achieves a score of ~63.5, outperforming many models that are 3 to 16 times larger in size (e.g., outperforming Falcon-40B, Vicuna-13B, and all 7B-class models except Llama3-8B-it and Qwen1.5-7B-Chat).
* **Cluster of 7B Models:** A dense cluster of models exists between 6B and 8B parameters, showing a wide performance spread of over 18 points (from ~47 to ~66).
### Interpretation
This chart is designed to showcase the exceptional efficiency of the **Memory³-2B-SFT** model. The core message is that this specific 2.5B-parameter model achieves benchmark performance rivaling or exceeding that of models 4 to 16 times its size.
The data suggests that raw parameter count is not the sole determinant of benchmark performance. Architectural innovations, training data quality, and training methodology (like the "Memory³" technique implied by the name) can lead to dramatic improvements in efficiency. The plot argues for the value of developing smaller, more efficient models that can deliver high performance without the computational cost of massive models.
The wide scatter among similarly sized models (especially the 7B class) further emphasizes that factors beyond scale are critical. The outlier status of Memory³-2B-SFT positions it as a significant advancement in the pursuit of high-performance, compact language models.