## Line Graphs: Model Accuracy Comparison Across Datasets
### Overview
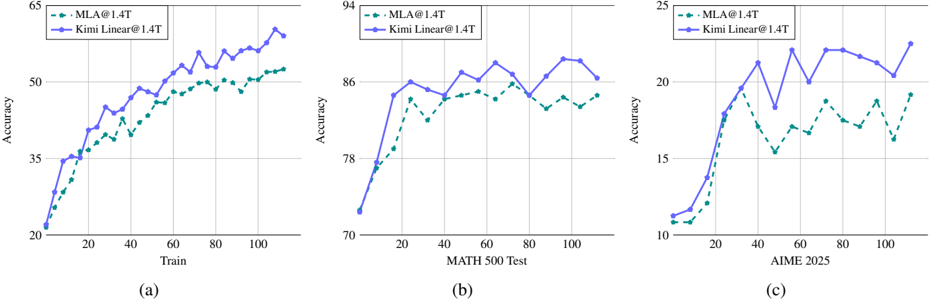
The image contains three line graphs comparing the accuracy of two models, **MLA@1.4T** (green dashed line) and **Kimi Linear@1.4T** (blue solid line), across different datasets. Each graph tracks accuracy progression during training or evaluation phases.
---
### Components/Axes
1. **Graph (a)**
- **X-axis**: "Train" (intervals: 0, 20, 40, 60, 80, 100)
- **Y-axis**: "Accuracy" (range: 20–65)
- **Legend**: Top-left corner, labels:
- Green dashed line: MLA@1.4T
- Blue solid line: Kimi Linear@1.4T
2. **Graph (b)**
- **X-axis**: "MATH 500 Test" (intervals: 0, 20, 40, 60, 80, 100)
- **Y-axis**: "Accuracy" (range: 70–94)
- **Legend**: Top-left corner, same labels as Graph (a).
3. **Graph (c)**
- **X-axis**: "AIME 2025" (intervals: 0, 20, 40, 60, 80, 100)
- **Y-axis**: "Accuracy" (range: 10–25)
- **Legend**: Top-left corner, same labels as Graph (a).
---
### Detailed Analysis
#### Graph (a): Training Accuracy
- **MLA@1.4T**: Starts at ~20% accuracy, steadily increases to ~50% by 100 steps.
- **Kimi Linear@1.4T**: Begins at ~25%, surpasses MLA@1.4T after ~60 steps, reaching ~55% by 100 steps.
- **Trend**: Both models improve, but Kimi Linear@1.4T outperforms MLA@1.4T in later stages.
#### Graph (b): MATH 500 Test Accuracy
- **MLA@1.4T**: Starts at ~75%, fluctuates between ~78%–86%, peaking at ~86%.
- **Kimi Linear@1.4T**: Begins at ~78%, rises to ~88%, then dips slightly to ~86%.
- **Trend**: Kimi Linear@1.4T maintains higher accuracy, with minor volatility.
#### Graph (c): AIME 2025 Accuracy
- **MLA@1.4T**: Starts at ~10%, rises to ~18%, then dips to ~16% before recovering to ~19%.
- **Kimi Linear@1.4T**: Begins at ~12%, surges to ~24%, then declines to ~21% before rising to ~24%.
- **Trend**: Kimi Linear@1.4T shows sharper initial gains but higher volatility.
---
### Key Observations
1. **Dataset-Specific Performance**:
- Kimi Linear@1.4T excels in AIME 2025 (highest final accuracy: ~24%).
- MLA@1.4T performs more consistently in MATH 500 Test.
2. **Training Dynamics**:
- Kimi Linear@1.4T overtakes MLA@1.4T during training (Graph a) but shows instability in AIME 2025.
3. **Volatility**:
- MLA@1.4T exhibits smoother trends in MATH 500 Test, while Kimi Linear@1.4T has sharper fluctuations.
---
### Interpretation
The data suggests **task-dependent model efficacy**:
- **Kimi Linear@1.4T** may be optimized for complex reasoning tasks (AIME 2025) but requires stabilization.
- **MLA@1.4T** demonstrates robustness in standardized tests (MATH 500) but lags in advanced benchmarks.
- Training dynamics indicate Kimi Linear@1.4T’s potential for rapid improvement but highlights trade-offs between speed and stability.
No textual content in non-English languages is present. All values are approximate, with uncertainty due to visual estimation from the graph.