## Line Charts: Model Accuracy Comparison
### Overview
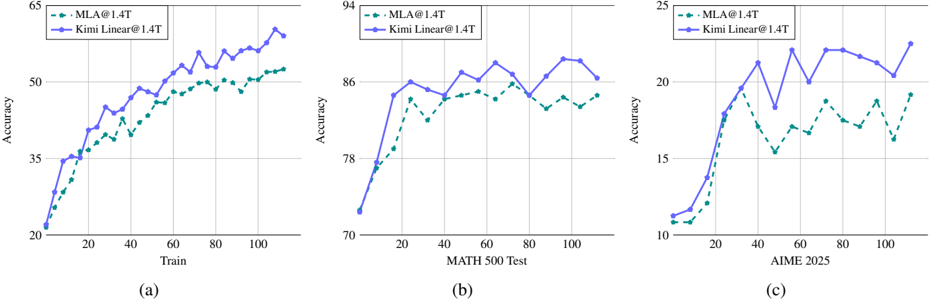
The image presents three line charts comparing the accuracy of two models, "MLA@1.4T" and "Kimi Linear@1.4T", across different tasks: "Train", "MATH 500 Test", and "AIME 2025". Each chart plots accuracy against the task or training iterations.
### Components/Axes
**General Chart Elements:**
* **Title:** There is no overall title for the figure.
* **Legend:** Located in the top-left corner of each chart.
* "MLA@1.4T": Represented by a dashed teal line.
* "Kimi Linear@1.4T": Represented by a solid blue-purple line.
**Chart (a): Train**
* **X-axis:** "Train" - Represents the number of training iterations. Scale ranges from approximately 0 to 100, with tick marks at intervals of 20.
* **Y-axis:** "Accuracy" - Represents the accuracy score. Scale ranges from 20 to 65, with tick marks at intervals of 15.
**Chart (b): MATH 500 Test**
* **X-axis:** "MATH 500 Test" - Represents the test iterations. Scale ranges from approximately 0 to 100, with tick marks at intervals of 20.
* **Y-axis:** "Accuracy" - Represents the accuracy score. Scale ranges from 70 to 94, with tick marks at intervals of approximately 8.
**Chart (c): AIME 2025**
* **X-axis:** "AIME 2025" - Represents the test iterations. Scale ranges from approximately 0 to 100, with tick marks at intervals of 20.
* **Y-axis:** "Accuracy" - Represents the accuracy score. Scale ranges from 10 to 25, with tick marks at intervals of 5.
### Detailed Analysis
**Chart (a): Train**
* **MLA@1.4T (dashed teal line):** The accuracy starts at approximately 22 and increases steadily until around 60 training iterations, reaching approximately 48. After 60 iterations, the accuracy plateaus and fluctuates around 50.
* **Kimi Linear@1.4T (solid blue-purple line):** The accuracy starts at approximately 22 and increases steadily throughout the training iterations, reaching approximately 58 at 100 iterations.
**Chart (b): MATH 500 Test**
* **MLA@1.4T (dashed teal line):** The accuracy starts at approximately 77, increases to approximately 85 around 20 iterations, and then fluctuates between 84 and 87 for the remaining iterations.
* **Kimi Linear@1.4T (solid blue-purple line):** The accuracy starts at approximately 72, increases to approximately 86 around 20 iterations, and then fluctuates between 84 and 88 for the remaining iterations.
**Chart (c): AIME 2025**
* **MLA@1.4T (dashed teal line):** The accuracy starts at approximately 11, increases to approximately 20 around 40 iterations, and then fluctuates between 17 and 20 for the remaining iterations.
* **Kimi Linear@1.4T (solid blue-purple line):** The accuracy starts at approximately 11, increases to approximately 22 around 60 iterations, and then fluctuates between 18 and 23 for the remaining iterations.
### Key Observations
* In the "Train" task, "Kimi Linear@1.4T" consistently outperforms "MLA@1.4T" after approximately 40 training iterations.
* In the "MATH 500 Test" task, both models perform similarly, with "Kimi Linear@1.4T" showing slightly higher accuracy overall.
* In the "AIME 2025" task, "Kimi Linear@1.4T" generally outperforms "MLA@1.4T", showing higher peaks and a more volatile accuracy trend.
### Interpretation
The charts suggest that "Kimi Linear@1.4T" generally performs better than "MLA@1.4T" across the three tasks, especially in the "Train" and "AIME 2025" tasks. The "MATH 500 Test" task shows comparable performance between the two models. The increasing accuracy with training iterations in the "Train" task indicates that both models are learning from the data. The fluctuations in accuracy in the "MATH 500 Test" and "AIME 2025" tasks suggest that these tasks are more challenging or that the models are more sensitive to the specific test data.