## Line Graph: Explore Performance vs. Search Depth
### Overview
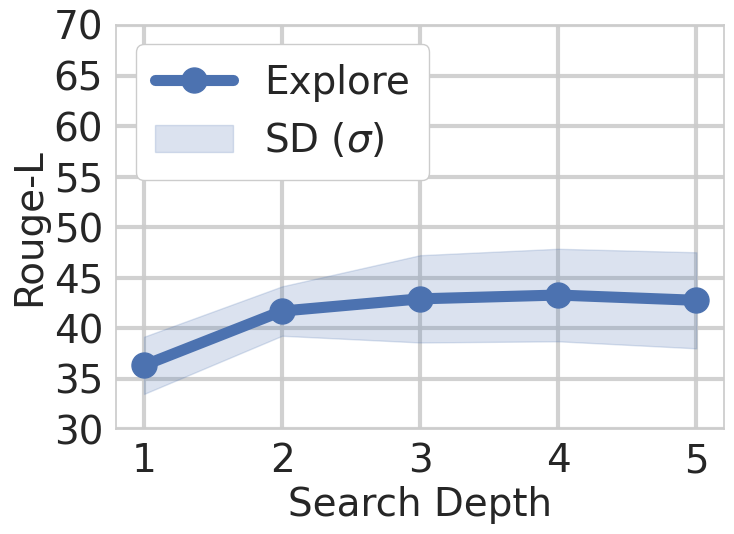
The image depicts a line graph illustrating the relationship between "Search Depth" (x-axis) and "Rouge-L" scores (y-axis). A blue line labeled "Explore" represents the central trend, while a light blue shaded area labeled "SD (σ)" indicates variability (standard deviation). The graph spans Search Depth values 1–5 and Rouge-L scores from 30–70.
### Components/Axes
- **X-axis (Search Depth)**: Integer values 1–5, labeled "Search Depth."
- **Y-axis (Rouge-L)**: Continuous scale from 30–70, labeled "Rouge-L."
- **Legend**:
- "Explore": Blue line with circular markers.
- "SD (σ)": Light blue shaded area representing standard deviation.
- **Placement**: Legend is positioned in the top-left corner of the graph.
### Detailed Analysis
- **Data Points (Explore)**:
- Search Depth 1: ~36
- Search Depth 2: ~41
- Search Depth 3: ~43
- Search Depth 4: ~43
- Search Depth 5: ~43
- **Trend**: The "Explore" line shows a gradual upward slope from Search Depth 1 to 2, followed by a plateau from 3–5. The shaded area (SD) remains consistent in width (~2–3 units) across all Search Depths, indicating stable variability.
### Key Observations
1. **Initial Growth**: Rouge-L scores increase by ~5 units between Search Depth 1 and 2.
2. **Plateau Effect**: Scores stabilize at ~43 from Search Depth 3 onward.
3. **Consistent Variability**: The standard deviation (shaded area) does not widen significantly, suggesting minimal fluctuation in performance across depths.
### Interpretation
The data suggests that the "Explore" method achieves its highest performance gain when increasing Search Depth from 1 to 2, after which further depth yields diminishing returns. The stable standard deviation implies that the method’s results are relatively consistent, with no significant outliers or anomalies. This could indicate that the Explore algorithm’s effectiveness plateaus at moderate search depths, making deeper searches computationally inefficient unless additional gains are prioritized.