## Line Chart: Test Time Search Performance on AMC
### Overview
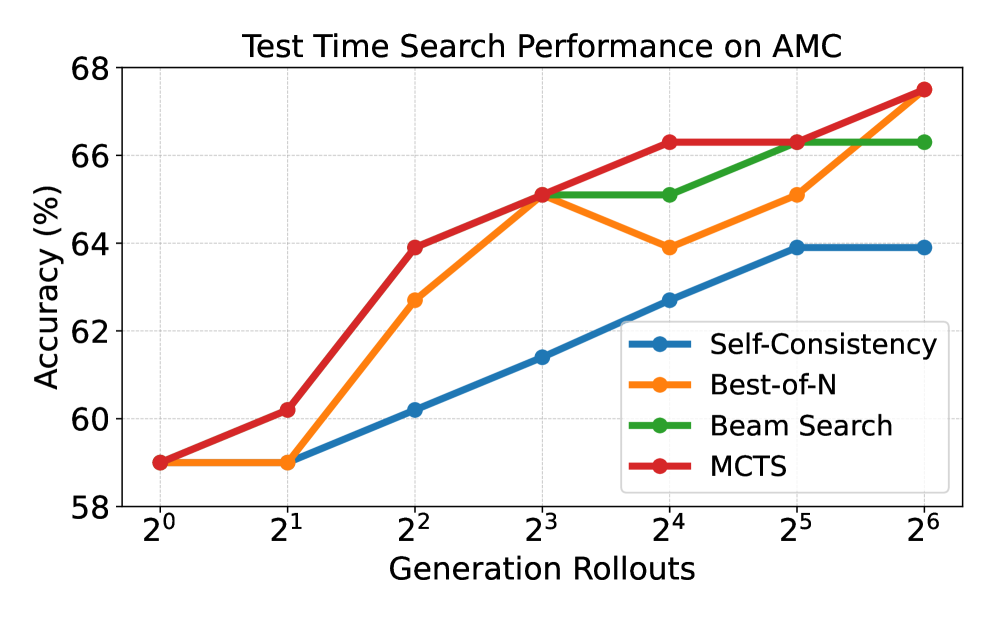
The image is a line chart comparing the accuracy of four different search algorithms (Self-Consistency, Best-of-N, Beam Search, and MCTS) as a function of generation rollouts. The x-axis represents generation rollouts on a logarithmic scale (base 2), and the y-axis represents accuracy in percentage.
### Components/Axes
* **Title:** Test Time Search Performance on AMC
* **X-axis:**
* Label: Generation Rollouts
* Scale: Logarithmic (base 2)
* Markers: 2<sup>0</sup>, 2<sup>1</sup>, 2<sup>2</sup>, 2<sup>3</sup>, 2<sup>4</sup>, 2<sup>5</sup>, 2<sup>6</sup>
* **Y-axis:**
* Label: Accuracy (%)
* Scale: Linear
* Markers: 58, 60, 62, 64, 66, 68
* **Legend:** Located in the bottom-right corner.
* Self-Consistency (Blue)
* Best-of-N (Orange)
* Beam Search (Green)
* MCTS (Red)
### Detailed Analysis
* **Self-Consistency (Blue):**
* Trend: Generally increasing with generation rollouts.
* Data Points:
* 2<sup>0</sup>: ~59%
* 2<sup>1</sup>: ~59%
* 2<sup>2</sup>: ~60%
* 2<sup>3</sup>: ~61.5%
* 2<sup>4</sup>: ~62.7%
* 2<sup>5</sup>: ~64%
* 2<sup>6</sup>: ~64%
* **Best-of-N (Orange):**
* Trend: Increases initially, then decreases slightly, and increases again.
* Data Points:
* 2<sup>0</sup>: ~59%
* 2<sup>1</sup>: ~59%
* 2<sup>2</sup>: ~63%
* 2<sup>3</sup>: ~65%
* 2<sup>4</sup>: ~64%
* 2<sup>5</sup>: ~65%
* 2<sup>6</sup>: ~67%
* **Beam Search (Green):**
* Trend: Increases, plateaus, then increases again.
* Data Points:
* 2<sup>0</sup>: ~59%
* 2<sup>1</sup>: ~59%
* 2<sup>2</sup>: ~64%
* 2<sup>3</sup>: ~65%
* 2<sup>4</sup>: ~65%
* 2<sup>5</sup>: ~66%
* 2<sup>6</sup>: ~66%
* **MCTS (Red):**
* Trend: Consistently increasing with generation rollouts.
* Data Points:
* 2<sup>0</sup>: ~59%
* 2<sup>1</sup>: ~60%
* 2<sup>2</sup>: ~64%
* 2<sup>3</sup>: ~65.2%
* 2<sup>4</sup>: ~66.3%
* 2<sup>5</sup>: ~66.3%
* 2<sup>6</sup>: ~67.5%
### Key Observations
* MCTS (Red) generally performs the best, achieving the highest accuracy at the end.
* Self-Consistency (Blue) has the lowest initial accuracy and increases steadily, but plateaus at 2<sup>5</sup>.
* Best-of-N (Orange) and Beam Search (Green) show similar performance, with Best-of-N eventually surpassing Beam Search.
* All algorithms show improvement in accuracy as the number of generation rollouts increases, but the rate of improvement varies.
### Interpretation
The chart illustrates the performance of different search algorithms in terms of accuracy as the number of generation rollouts increases. MCTS appears to be the most effective algorithm for this task, consistently achieving higher accuracy compared to the others. Self-Consistency, while showing steady improvement, plateaus at higher generation rollouts. Best-of-N and Beam Search offer comparable performance, with Best-of-N eventually outperforming Beam Search. The data suggests that increasing generation rollouts generally improves accuracy, but the extent of improvement depends on the specific algorithm used. The choice of algorithm and the number of generation rollouts should be carefully considered to optimize performance for the given task.