## Line Chart: Test Time Search Performance on AMC
### Overview
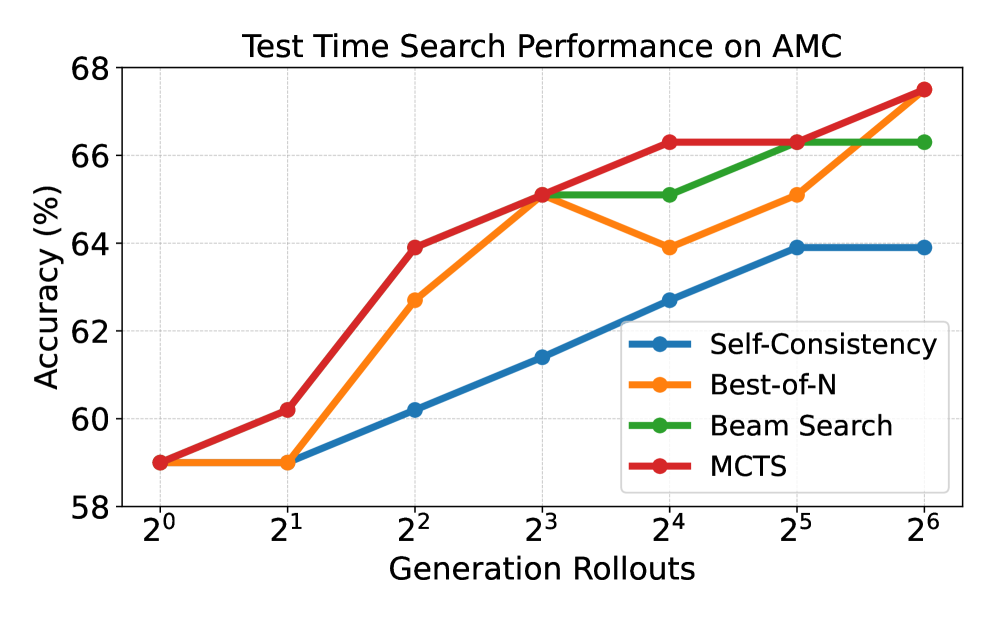
The image presents a line chart illustrating the performance of four different search algorithms (Self-Consistency, Best-of-N, Beam Search, and MCTS) on the AMC task, measured by accuracy as a function of generation rollouts. The chart displays how accuracy changes as the number of generation rollouts increases from 2<sup>0</sup> to 2<sup>6</sup>.
### Components/Axes
* **Title:** "Test Time Search Performance on AMC" (centered at the top)
* **X-axis:** "Generation Rollouts" (bottom-horizontal). Markers are at 2<sup>0</sup>, 2<sup>1</sup>, 2<sup>2</sup>, 2<sup>3</sup>, 2<sup>4</sup>, 2<sup>5</sup>, and 2<sup>6</sup>.
* **Y-axis:** "Accuracy (%)" (left-vertical). Scale ranges from 58% to 68%.
* **Legend:** Located in the top-right corner. Contains the following entries with corresponding colors:
* Self-Consistency (Blue)
* Best-of-N (Orange)
* Beam Search (Green)
* MCTS (Red)
### Detailed Analysis
The chart displays four distinct lines, each representing a search algorithm's accuracy as generation rollouts increase.
* **Self-Consistency (Blue):** The line starts at approximately 58% accuracy at 2<sup>0</sup> rollouts. It increases slowly to around 61% at 2<sup>1</sup>, then rises more steeply to approximately 63% at 2<sup>2</sup>. It plateaus around 63-64% for the remaining rollouts (2<sup>3</sup> through 2<sup>6</sup>).
* **Best-of-N (Orange):** The line begins at approximately 58% accuracy at 2<sup>0</sup> rollouts. It dips to around 59% at 2<sup>1</sup>, then increases rapidly to approximately 64% at 2<sup>2</sup>. It continues to increase, reaching around 66% at 2<sup>4</sup> and finally approximately 67% at 2<sup>6</sup>.
* **Beam Search (Green):** The line starts at approximately 58% accuracy at 2<sup>0</sup> rollouts. It increases steadily to around 62% at 2<sup>1</sup>, then rises more sharply to approximately 65% at 2<sup>2</sup>. It continues to increase, reaching approximately 66% at 2<sup>3</sup> and 67% at 2<sup>6</sup>.
* **MCTS (Red):** The line begins at approximately 58% accuracy at 2<sup>0</sup> rollouts. It increases rapidly to approximately 63% at 2<sup>1</sup>, then continues to increase sharply to approximately 65% at 2<sup>2</sup>. It continues to increase, reaching approximately 67% at 2<sup>4</sup> and approximately 68% at 2<sup>6</sup>.
### Key Observations
* MCTS consistently demonstrates the highest accuracy across all generation rollout values.
* Self-Consistency shows the slowest improvement in accuracy and plateaus at a lower level compared to the other algorithms.
* Best-of-N and Beam Search exhibit similar trends, with Beam Search slightly outperforming Best-of-N at higher rollout values.
* All algorithms show a significant performance boost between 2<sup>0</sup> and 2<sup>2</sup> rollouts.
* The performance gains diminish as the number of rollouts increases beyond 2<sup>3</sup>.
### Interpretation
The data suggests that increasing the number of generation rollouts generally improves the accuracy of all four search algorithms on the AMC task. However, the extent of improvement varies significantly between algorithms. MCTS appears to be the most effective algorithm, consistently achieving the highest accuracy. Self-Consistency, while improving with rollouts, reaches a performance ceiling relatively quickly. The diminishing returns observed at higher rollout values suggest that there is a point of diminishing returns where further increasing rollouts does not yield substantial accuracy gains. This could be due to factors such as computational cost or the inherent limitations of the algorithms themselves. The initial rapid improvement likely reflects the algorithms' ability to explore the search space more effectively with increased computational effort. The differences in performance between the algorithms highlight the importance of algorithm selection for optimal performance on this task.