## Line Chart: % Negative Objects vs. Epochs
### Overview
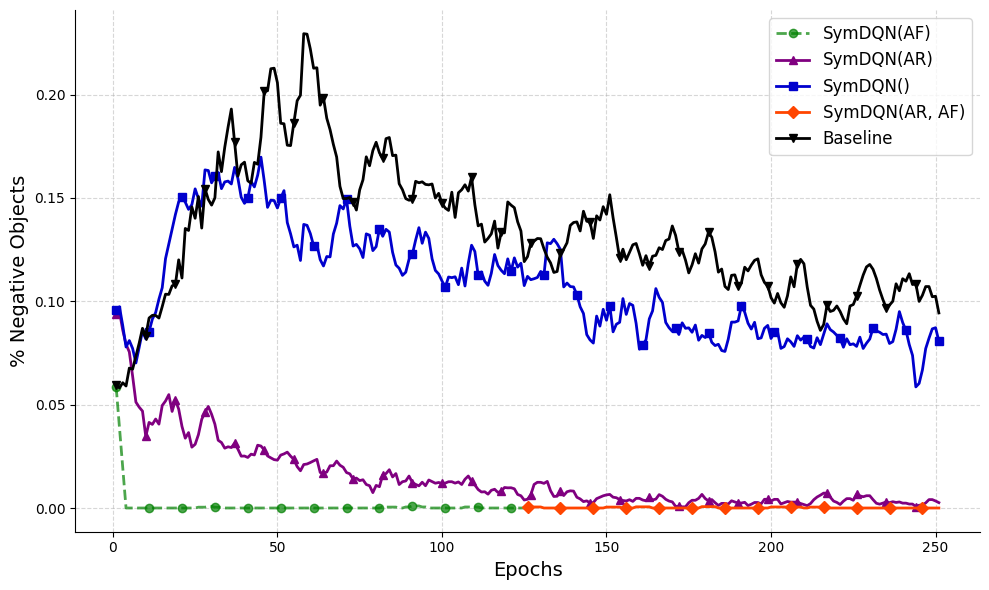
The image is a line chart comparing the percentage of negative objects detected by different SymDQN models (SymDQN(AF), SymDQN(AR), SymDQN(), SymDQN(AR, AF)) and a Baseline model over 250 epochs. The y-axis represents the percentage of negative objects, ranging from 0.00 to 0.20. The x-axis represents the number of epochs, ranging from 0 to 250.
### Components/Axes
* **X-axis:** Epochs, with markers at 0, 50, 100, 150, 200, and 250.
* **Y-axis:** % Negative Objects, with markers at 0.00, 0.05, 0.10, 0.15, and 0.20.
* **Legend:** Located in the top-right corner, it identifies each line by color and label:
* Green dashed line with circles: SymDQN(AF)
* Purple line with triangles: SymDQN(AR)
* Blue line with squares: SymDQN()
* Orange line with diamonds: SymDQN(AR, AF)
* Black line with inverted triangles: Baseline
### Detailed Analysis
* **SymDQN(AF) (Green, dashed):** This line remains consistently at approximately 0.00% throughout the 250 epochs.
* **SymDQN(AR) (Purple):** Starts at approximately 0.06% at epoch 0, rapidly decreases to approximately 0.01% by epoch 50, and then fluctuates slightly around 0.01% for the remaining epochs.
* **SymDQN() (Blue):** Starts at approximately 0.09% at epoch 0, increases to approximately 0.16% by epoch 50, then gradually decreases to approximately 0.08% by epoch 250.
* **SymDQN(AR, AF) (Orange):** Starts near 0.00% and remains consistently near 0.00% throughout the 250 epochs, with slight fluctuations.
* **Baseline (Black):** Starts at approximately 0.06% at epoch 0, increases sharply to approximately 0.22% by epoch 50, and then gradually decreases to approximately 0.10% by epoch 250, with significant fluctuations throughout.
### Key Observations
* SymDQN(AF) and SymDQN(AR, AF) consistently maintain a very low percentage of negative objects.
* SymDQN(AR) quickly reduces the percentage of negative objects and maintains a low level.
* SymDQN() and Baseline show a similar trend of increasing and then decreasing percentage of negative objects, but SymDQN() generally has a lower percentage than the Baseline.
* The Baseline model exhibits the highest percentage of negative objects and the most significant fluctuations.
### Interpretation
The chart compares the performance of different SymDQN models and a baseline model in terms of the percentage of negative objects detected over 250 epochs. The results suggest that SymDQN(AF) and SymDQN(AR, AF) are the most effective at minimizing the detection of negative objects, as their percentages remain consistently near zero. SymDQN(AR) also performs well, quickly reducing the percentage of negative objects. SymDQN() performs better than the Baseline, indicating that it offers some improvement. The Baseline model shows the highest percentage of negative objects and the most instability, suggesting it is the least effective of the models tested. The initial increase in negative objects for the Baseline and SymDQN() models could indicate an initial learning phase where the models are still adjusting to the data. The subsequent decrease suggests that the models eventually learn to reduce the detection of negative objects, although the Baseline model does so less effectively than SymDQN().