## Line Charts: NeurRL Performance vs. Parameter Settings
### Overview
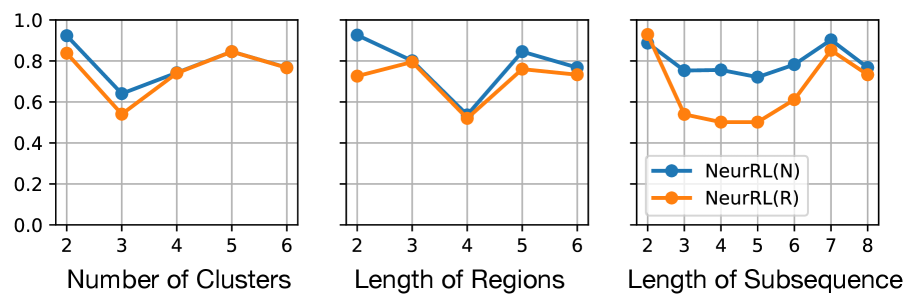
The image presents three line charts comparing the performance of two algorithms, NeurRL(N) and NeurRL(R), across different parameter settings. The charts depict performance (y-axis) against "Number of Clusters", "Length of Regions", and "Length of Subsequence" (x-axis).
### Components/Axes
* **Y-axis (all charts):** Performance, ranging from 0.0 to 1.0 in increments of 0.2.
* **X-axis (left chart):** Number of Clusters, ranging from 2 to 6 in increments of 1.
* **X-axis (middle chart):** Length of Regions, ranging from 2 to 6 in increments of 1.
* **X-axis (right chart):** Length of Subsequence, ranging from 2 to 8 in increments of 1.
* **Legend (bottom-right):**
* Blue line with circle markers: NeurRL(N)
* Orange line with circle markers: NeurRL(R)
### Detailed Analysis
**Chart 1: Number of Clusters**
* **NeurRL(N) (Blue):** Starts at approximately 0.9 at 2 clusters, decreases to approximately 0.65 at 3 clusters, increases to approximately 0.75 at 4 clusters, increases to approximately 0.85 at 5 clusters, and decreases slightly to approximately 0.8 at 6 clusters.
* **NeurRL(R) (Orange):** Starts at approximately 0.85 at 2 clusters, decreases to approximately 0.55 at 3 clusters, increases to approximately 0.75 at 4 clusters, increases to approximately 0.85 at 5 clusters, and decreases to approximately 0.78 at 6 clusters.
**Chart 2: Length of Regions**
* **NeurRL(N) (Blue):** Starts at approximately 0.95 at length 2, decreases to approximately 0.8 at length 3, decreases to approximately 0.55 at length 4, increases to approximately 0.85 at length 5, and decreases slightly to approximately 0.8 at length 6.
* **NeurRL(R) (Orange):** Starts at approximately 0.75 at length 2, increases slightly to approximately 0.8 at length 3, decreases to approximately 0.55 at length 4, increases to approximately 0.75 at length 5, and increases slightly to approximately 0.78 at length 6.
**Chart 3: Length of Subsequence**
* **NeurRL(N) (Blue):** Starts at approximately 0.95 at length 2, decreases to approximately 0.75 at length 3, remains relatively stable at approximately 0.75 at length 4, decreases slightly to approximately 0.72 at length 5, increases to approximately 0.78 at length 6, increases to approximately 0.92 at length 7, and decreases to approximately 0.8 at length 8.
* **NeurRL(R) (Orange):** Starts at approximately 0.85 at length 2, decreases to approximately 0.52 at length 3, remains relatively stable at approximately 0.5 at length 4, increases to approximately 0.6 at length 5, increases to approximately 0.8 at length 6, increases to approximately 0.9 at length 7, and decreases to approximately 0.72 at length 8.
### Key Observations
* Both algorithms show performance variation with changes in "Number of Clusters", "Length of Regions", and "Length of Subsequence".
* NeurRL(N) generally outperforms NeurRL(R) across different parameter settings, especially for "Length of Subsequence".
* Both algorithms show a performance dip at a "Length of Regions" of 4.
* For "Length of Subsequence", both algorithms peak at a length of 7.
### Interpretation
The charts suggest that the performance of NeurRL algorithms is sensitive to the choice of parameters like "Number of Clusters", "Length of Regions", and "Length of Subsequence". NeurRL(N) appears to be more robust to parameter changes compared to NeurRL(R). The performance dip at a "Length of Regions" of 4 might indicate a critical threshold or a less optimal configuration for both algorithms. The peak performance at a "Length of Subsequence" of 7 suggests an optimal subsequence length for the given problem. Further investigation is needed to understand the underlying reasons for these performance variations and to optimize the parameter settings for each algorithm.