## Line Charts: Performance Comparison of NeurRL(N) vs. NeurRL(R)
### Overview
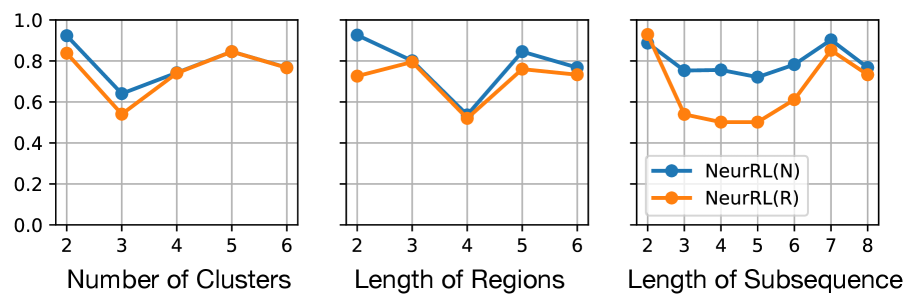
The image displays three horizontally arranged line charts comparing the performance (y-axis, 0.0 to 1.0) of two methods, **NeurRL(N)** (blue line) and **NeurRL(R)** (orange line), across three different independent variables. The charts share a common y-axis scale. A single legend is placed within the third chart.
### Components/Axes
* **Y-Axis (Shared):** Vertical axis on the left of each chart. Scale ranges from **0.0 to 1.0** with major grid lines at intervals of **0.2** (0.0, 0.2, 0.4, 0.6, 0.8, 1.0). No explicit axis title is present, but the context suggests it represents a performance metric (e.g., accuracy, score).
* **X-Axes (Individual):**
1. **Left Chart:** Titled **"Number of Clusters"**. Markers at integer values: **2, 3, 4, 5, 6**.
2. **Center Chart:** Titled **"Length of Regions"**. Markers at integer values: **2, 3, 4, 5, 6**.
3. **Right Chart:** Titled **"Length of Subsequence"**. Markers at integer values: **2, 3, 4, 5, 6, 7, 8**.
* **Legend:** Located in the **bottom-right corner of the third (rightmost) chart**. It defines the two data series:
* **Blue line with circle markers:** `NeurRL(N)`
* **Orange line with circle markers:** `NeurRL(R)`
### Detailed Analysis
**Chart 1: Number of Clusters**
* **Trend - NeurRL(N) (Blue):** Starts high, dips sharply, then recovers and plateaus.
* Points (approx.): (2, ~0.95), (3, ~0.65), (4, ~0.75), (5, ~0.85), (6, ~0.78).
* **Trend - NeurRL(R) (Orange):** Follows a similar pattern but is consistently lower than NeurRL(N) after the first point.
* Points (approx.): (2, ~0.85), (3, ~0.55), (4, ~0.75), (5, ~0.85), (6, ~0.78).
* **Relationship:** Both methods show a significant performance drop at 3 clusters. They converge at 4 and 5 clusters, with NeurRL(N) maintaining a slight lead at 2 and 6 clusters.
**Chart 2: Length of Regions**
* **Trend - NeurRL(N) (Blue):** Starts high, dips, then recovers to a peak before a slight decline.
* Points (approx.): (2, ~0.95), (3, ~0.80), (4, ~0.55), (5, ~0.85), (6, ~0.78).
* **Trend - NeurRL(R) (Orange):** Shows a more stable, slightly arched trend, peaking at 3.
* Points (approx.): (2, ~0.75), (3, ~0.80), (4, ~0.55), (5, ~0.78), (6, ~0.75).
* **Relationship:** NeurRL(N) outperforms at region lengths 2, 5, and 6. They perform identically at length 4 (the lowest point for both). NeurRL(R) slightly outperforms at length 3.
**Chart 3: Length of Subsequence**
* **Trend - NeurRL(N) (Blue):** Exhibits a fluctuating but generally high performance, with a notable dip at length 5.
* Points (approx.): (2, ~0.90), (3, ~0.78), (4, ~0.78), (5, ~0.72), (6, ~0.80), (7, ~0.90), (8, ~0.78).
* **Trend - NeurRL(R) (Orange):** Starts very high, drops sharply, then gradually recovers before a final dip.
* Points (approx.): (2, ~0.95), (3, ~0.55), (4, ~0.52), (5, ~0.52), (6, ~0.62), (7, ~0.88), (8, ~0.75).
* **Relationship:** NeurRL(R) starts higher but is significantly outperformed by NeurRL(N) from length 3 through 6. They nearly converge at length 7 before both decline at length 8.
### Key Observations
1. **Consistent Superiority:** NeurRL(N) (blue) generally achieves higher or equal performance compared to NeurRL(R) (orange) across most data points in all three experiments.
2. **Common Vulnerability Points:** Both methods show pronounced performance dips at specific parameter values: **3 clusters**, **4 region length**, and **3-5 subsequence length**.
3. **Convergence Points:** The methods often converge in performance at certain values (e.g., 4-5 clusters, 4 region length, 7 subsequence length), suggesting these are operating points where the distinction between the methods diminishes.
4. **Variable Impact:** The "Length of Subsequence" parameter (right chart) induces the most volatile performance swings for both methods, particularly for NeurRL(R).
### Interpretation
The data suggests that the **NeurRL(N)** variant is generally more robust and higher-performing than **NeurRL(R)** across a range of hyperparameters related to clustering, region segmentation, and subsequence analysis. The consistent dips indicate specific configurations where both models struggle, potentially revealing inherent challenges in the underlying task at those scales (e.g., a cluster count of 3 or a region length of 4 may represent a particularly ambiguous or complex problem structure).
The dramatic drop and recovery in the "Length of Subsequence" chart for NeurRL(R) implies it is highly sensitive to this parameter, performing well only with very short or optimally long subsequences, while NeurRL(N) maintains more stable performance. This could indicate that NeurRL(N) has better generalization or a more effective inductive bias for sequential data. The charts collectively serve to justify the selection of NeurRL(N) over NeurRL(R) and to guide the tuning of the presented hyperparameters for optimal system performance.