# Technical Data Extraction: Perplexity Analysis of Rank and Update Frequency
This document provides a detailed extraction of data from two line charts analyzing model performance (measured in Perplexity) relative to Rank and Update Frequency.
## General Metadata
* **Metric:** Perplexity ($\downarrow$) - Lower values indicate better performance.
* **Language:** English.
* **Visual Style:** Line charts with markers ('x') and dashed lines. A color gradient is used where lighter colors represent smaller values (lower rank or fewer steps) and darker/browner colors represent larger values (higher rank or more steps).
---
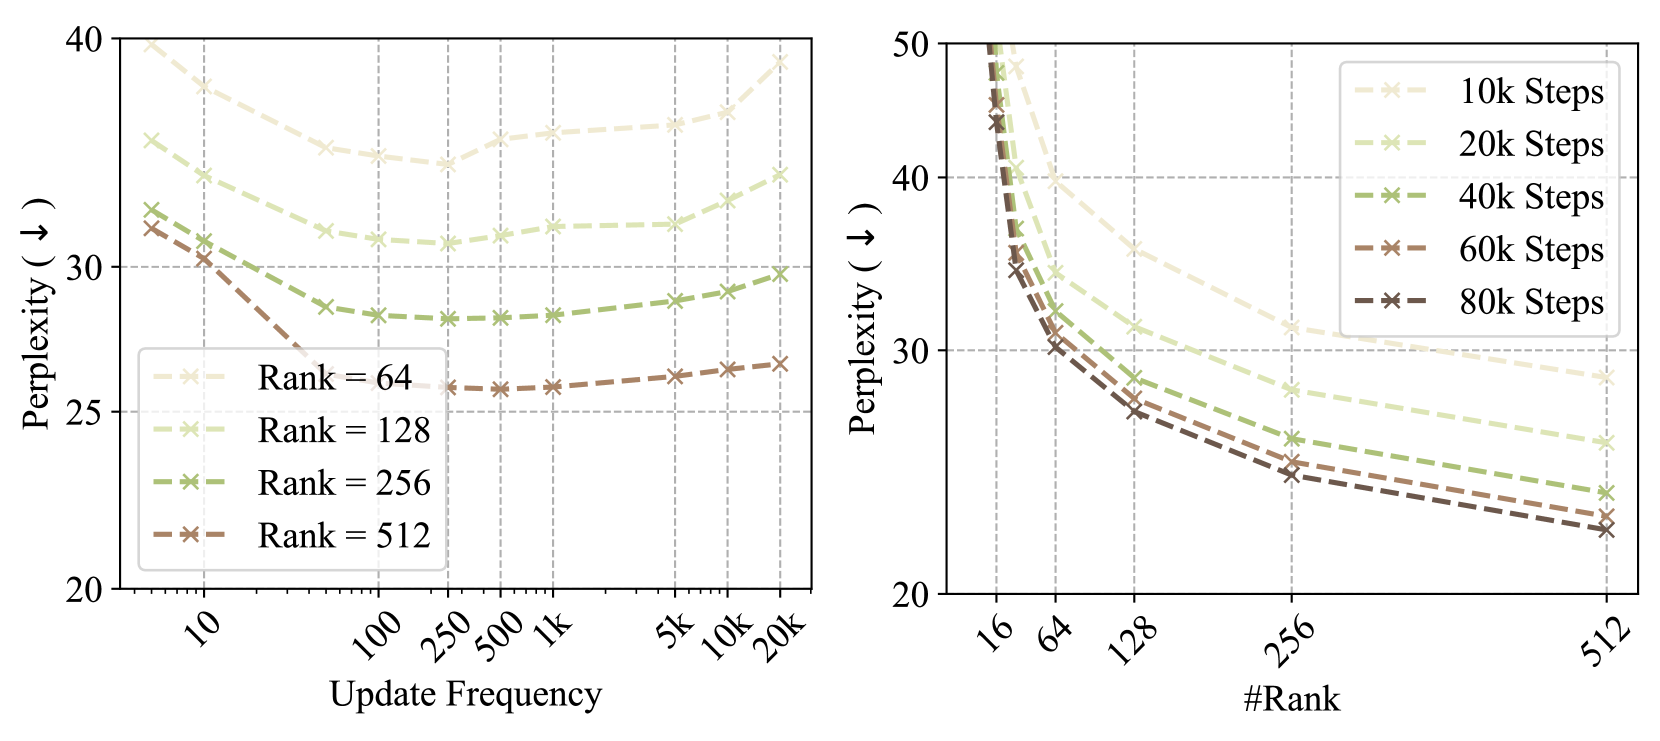
## Component 1: Left Chart - Perplexity vs. Update Frequency
### Axis and Labels
* **Y-Axis:** Perplexity ($\downarrow$). Scale: 20 to 40. Major ticks at 20, 25, 30, 40.
* **X-Axis:** Update Frequency. Logarithmic-style scale with specific categorical markers.
* **X-Axis Markers:** 10, 100, 250, 500, 1k, 5k, 10k, 20k.
* **Legend Location:** Bottom-left [x $\approx$ 0.1, y $\approx$ 0.2].
### Data Series (Legend: Rank)
The chart tracks four data series representing different Rank configurations.
| Series Color | Label | Trend Description |
| :--- | :--- | :--- |
| Lightest Cream | **Rank = 64** | Starts high (~40), dips to a minimum at Update Frequency 250 (~34), then rises sharply toward 20k (~39). |
| Pale Yellow | **Rank = 128** | Starts at ~35, reaches a minimum at Update Frequency 250 (~31), then rises slightly toward 20k (~34). |
| Light Green | **Rank = 256** | Starts at ~32, reaches a minimum at Update Frequency 250 (~28), then rises slightly toward 20k (~30). |
| Brown | **Rank = 512** | Starts at ~31, reaches a minimum at Update Frequency 500 (~26), then rises slightly toward 20k (~27). |
### Key Observations
* **Optimal Frequency:** All ranks show a "U-shaped" curve, indicating an optimal update frequency between 250 and 500.
* **Rank Impact:** Increasing the Rank consistently lowers the perplexity across all update frequencies.
---
## Component 2: Right Chart - Perplexity vs. #Rank
### Axis and Labels
* **Y-Axis:** Perplexity ($\downarrow$). Scale: 20 to 50. Major ticks at 20, 30, 40, 50.
* **X-Axis:** #Rank. Non-linear scale.
* **X-Axis Markers:** 16, 64, 128, 256, 512.
* **Legend Location:** Top-right [x $\approx$ 0.8, y $\approx$ 0.8].
### Data Series (Legend: Training Steps)
The chart tracks five data series representing the model's performance at different stages of training.
| Series Color | Label | Trend Description |
| :--- | :--- | :--- |
| Lightest Cream | **10k Steps** | Slopes downward sharply from Rank 16 (>50) to Rank 512 (~29). Highest perplexity overall. |
| Pale Yellow | **20k Steps** | Slopes downward; consistently lower than 10k steps. Ends at ~26 for Rank 512. |
| Light Green | **40k Steps** | Slopes downward; consistently lower than 20k steps. Ends at ~24 for Rank 512. |
| Medium Brown | **60k Steps** | Slopes downward; very close to the 80k steps line. Ends at ~23 for Rank 512. |
| Dark Brown | **80k Steps** | Slopes downward; represents the best performance (lowest perplexity). Ends at ~22 for Rank 512. |
### Data Point Extraction (Approximate)
| #Rank | 10k Steps | 20k Steps | 40k Steps | 60k Steps | 80k Steps |
| :--- | :--- | :--- | :--- | :--- | :--- |
| **16** | >50 | ~49 | ~47 | ~45 | ~44 |
| **64** | ~40 | ~34 | ~32 | ~31 | ~30 |
| **128** | ~35 | ~31 | ~29 | ~28 | ~27 |
| **256** | ~31 | ~28 | ~26 | ~25 | ~24 |
| **512** | ~29 | ~26 | ~24 | ~23 | ~22 |
### Key Observations
* **Diminishing Returns:** While increasing Rank always improves perplexity, the rate of improvement slows down significantly after Rank 256.
* **Training Convergence:** The gap between 60k and 80k steps is much smaller than the gap between 10k and 20k steps, suggesting the model is approaching convergence.