\n
## Diagram: Physical Experiments & General Laws
### Overview
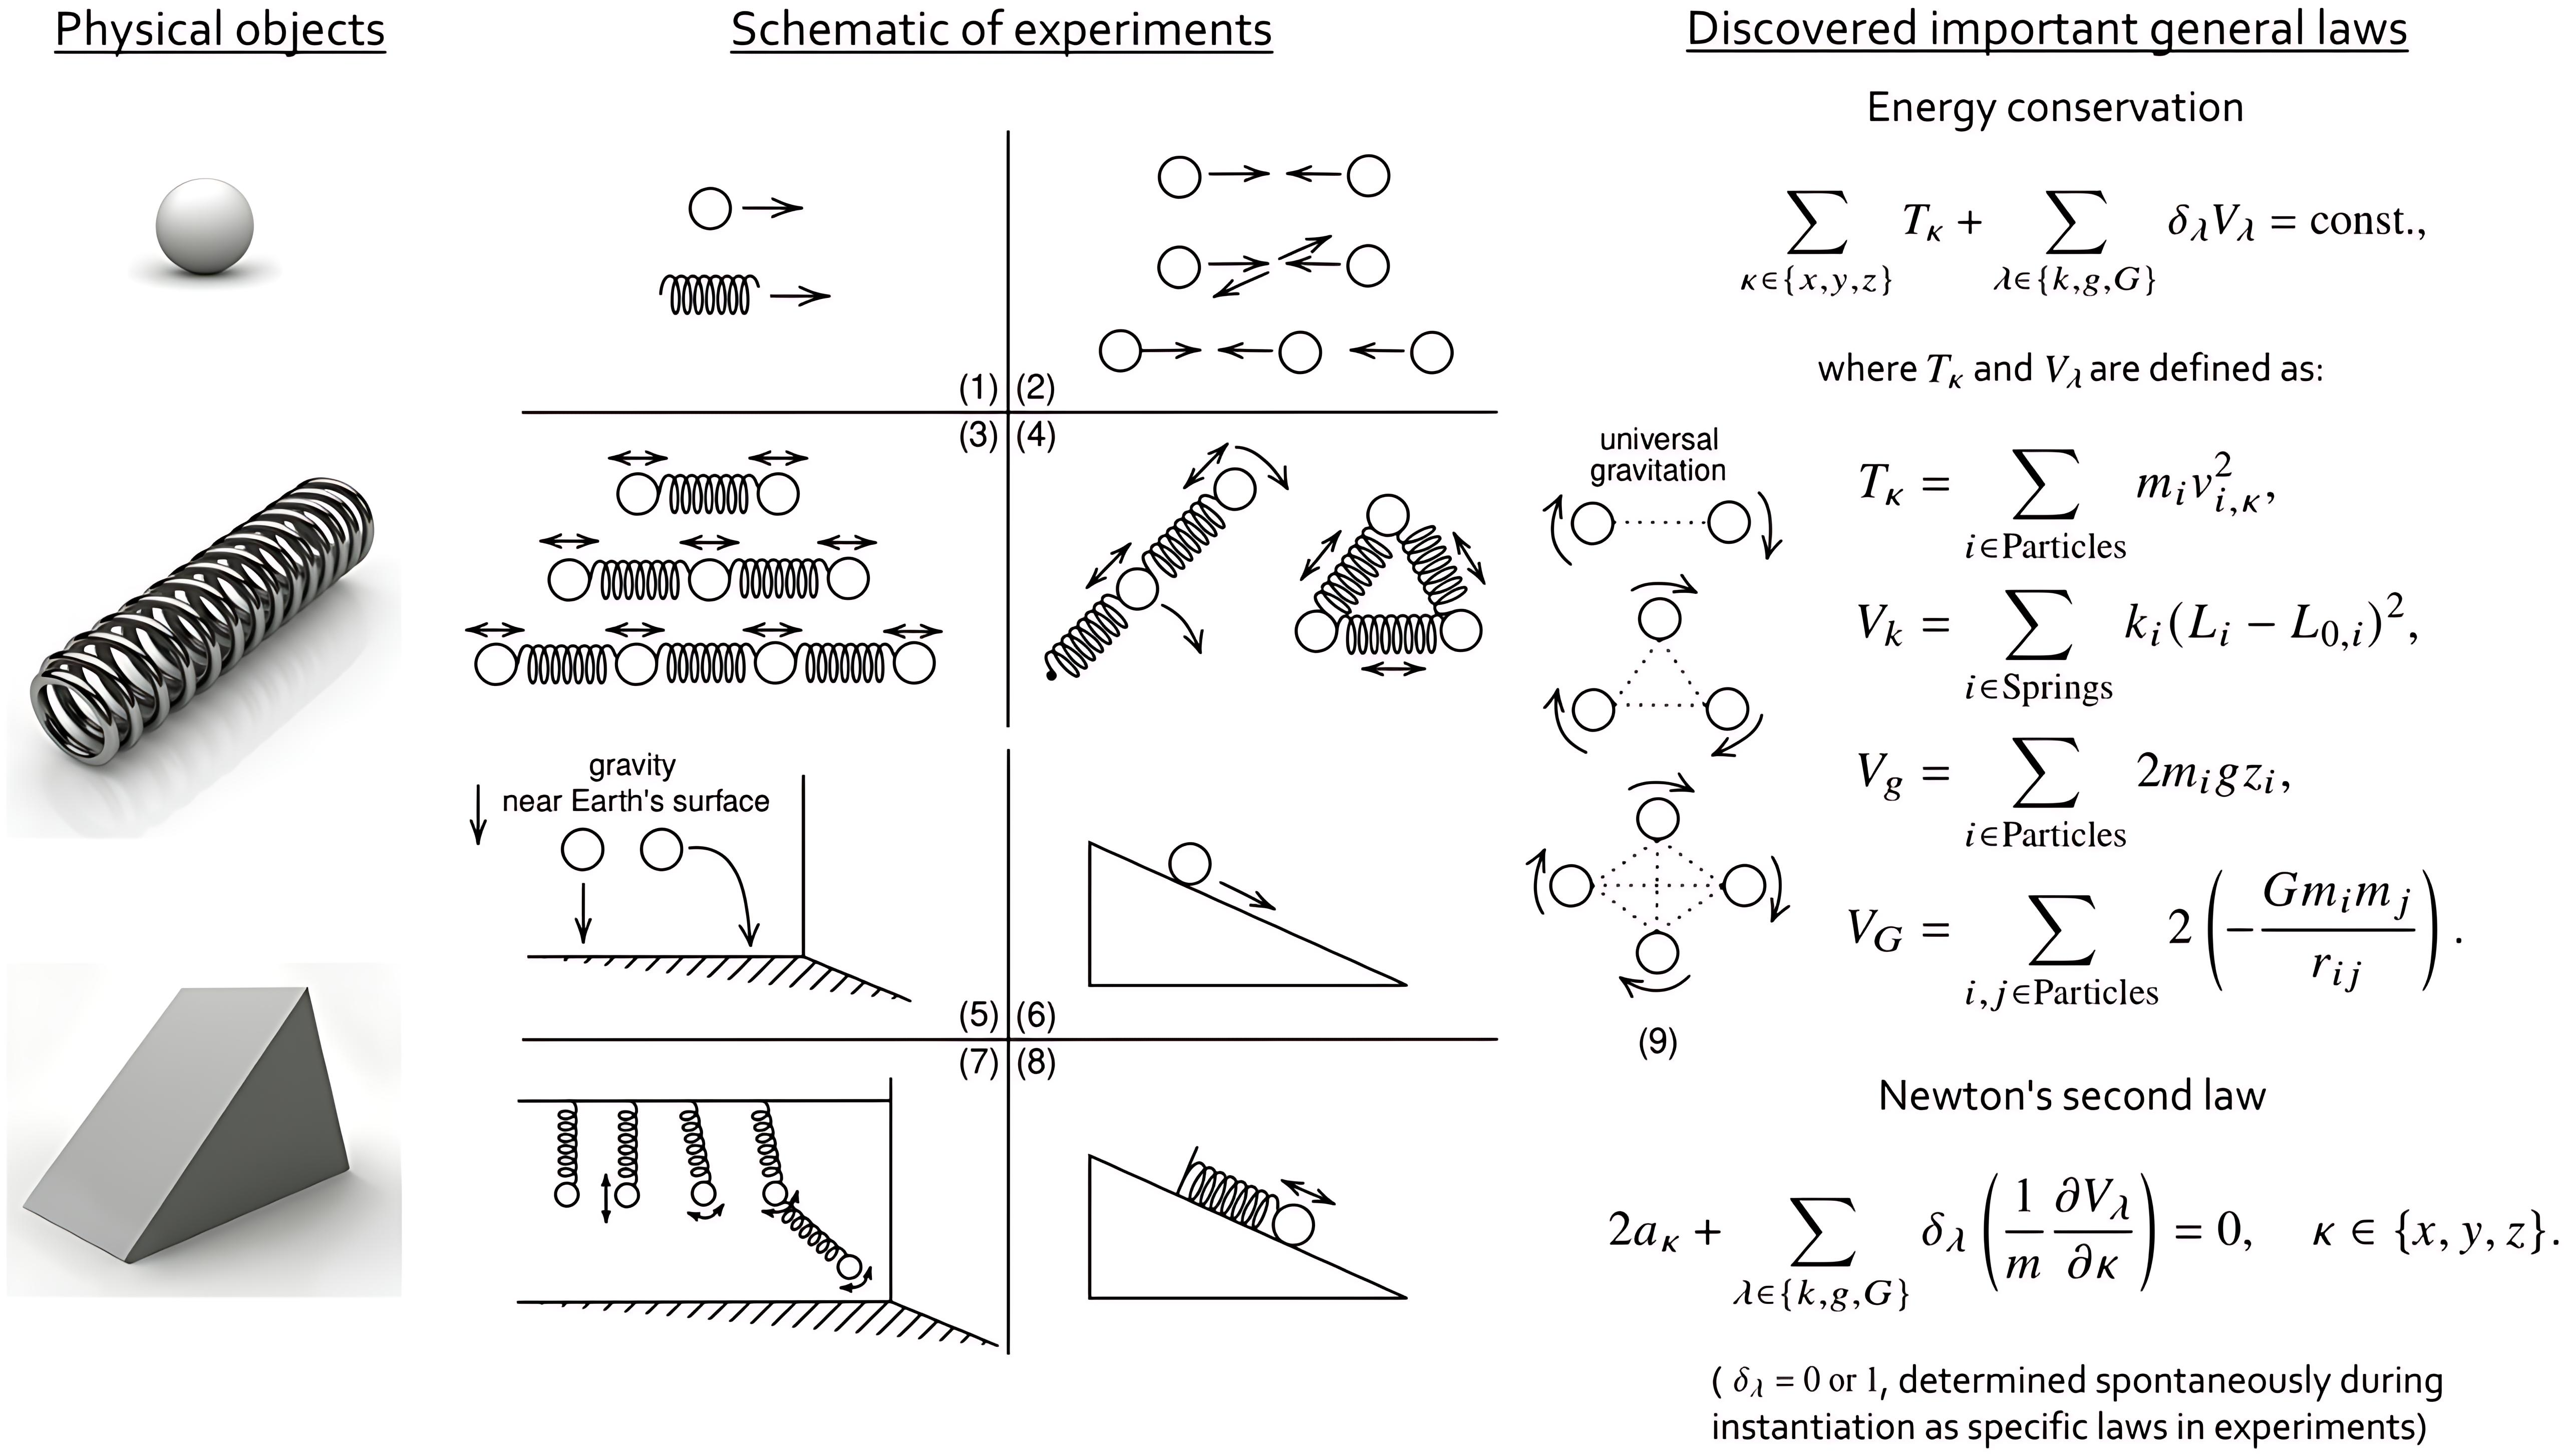
The image presents a visual connection between physical objects, schematic representations of experiments involving springs and spheres, and discovered general laws of physics – energy conservation and Newton's second law. The diagram is divided into three main sections: "Physical objects" (left), "Schematic of experiments" (center), and "Discovered important general laws" (right). The experiments appear to explore concepts related to gravity, motion, and energy transfer.
### Components/Axes
The diagram doesn't have traditional axes. Instead, it uses visual arrangement to convey relationships. The sections are labeled as follows:
* **Physical objects:** A sphere and a triangular prism.
* **Schematic of experiments:** Nine numbered diagrams depicting arrangements of spheres and springs.
* **Discovered important general laws:** Textual descriptions of energy conservation and Newton's second law, along with mathematical formulations.
### Detailed Analysis or Content Details
**Physical Objects (Left):**
* A sphere is depicted at the top.
* A triangular prism is depicted at the bottom.
**Schematic of Experiments (Center):**
The center section contains nine numbered diagrams:
1. A sphere connected to a spring, with an arrow indicating motion.
2. Two spheres connected by a spring, with arrows indicating reciprocal motion.
3. Multiple spheres connected in a chain by springs, with arrows indicating wave-like motion.
4. A sphere connected to a spring, angled upwards, suggesting motion against gravity.
5. A sphere resting on a spring above a surface.
6. A sphere compressing a spring on a surface.
7. A sphere compressing a spring on a surface, with an arrow indicating release.
8. A sphere compressing a spring on a surface, with an arrow indicating release and upward motion.
9. A sphere rolling down an inclined plane with a spring at the bottom.
**Discovered Important General Laws (Right):**
* **Energy Conservation:** The equation is: ∑<sub>κ∈{x,y,z}</sub> T<sub>κ</sub> + ∑<sub>λ∈{k,g,G}</sub> δ<sub>λ</sub>V<sub>λ</sub> = const.
* Definitions:
* T<sub>κ</sub> = ∑<sub>i∈Particles</sub> m<sub>i</sub>v<sub>κ</sub><sup>2</sup>
* V<sub>κ</sub> = ∑<sub>i∈springs</sub> k<sub>i</sub>(L<sub>i</sub> - L<sub>0</sub>)<sup>2</sup>
* V<sub>g</sub> = ∑<sub>i∈Particles</sub> 2m<sub>i</sub>gZ<sub>i</sub>
* V<sub>G</sub> = ∑<sub>i,j∈Particles</sub> G m<sub>i</sub>m<sub>j</sub> / r<sub>ij</sub>
* **Newton's Second Law:** The equation is: 2a<sub>κ</sub> + ∑<sub>λ∈{k,g,G}</sub> δ<sub>λ</sub>(1/m ∂V<sub>λ</sub>/∂κ) = 0, κ∈{x,y,z}.
* Note: (δ<sub>λ</sub> = 0 or 1, determined spontaneously during instantiation as specific laws in experiments)
### Key Observations
* The experiments progressively increase in complexity, starting with a single spring-sphere system and culminating in a rolling sphere on an inclined plane.
* The diagrams visually represent concepts like oscillation, wave propagation, and the influence of gravity.
* The mathematical formulations of energy conservation and Newton's second law provide a quantitative framework for understanding the observed phenomena.
* The use of δ<sub>λ</sub> in the equations suggests a conditional application of certain forces or potentials based on the specific experimental setup.
### Interpretation
The diagram illustrates a conceptual progression from simple physical systems to fundamental laws of physics. The experiments are designed to demonstrate how energy is conserved and how forces affect motion. The mathematical equations provide a precise description of these relationships. The inclusion of δ<sub>λ</sub> suggests that the laws are not universally applicable but are contingent on the specific conditions of the experiment. The diagram implies a scientific method approach: observation of physical phenomena (experiments) leading to the formulation of general laws (mathematical equations). The arrangement of the diagram suggests a cause-and-effect relationship: physical objects and experiments inspire the discovery of general laws. The diagram is a high-level conceptual overview rather than a detailed quantitative analysis. It serves as a visual aid for understanding the interconnectedness of physics concepts.