## Bar Chart: Accuracy of Clustering Algorithms
### Overview
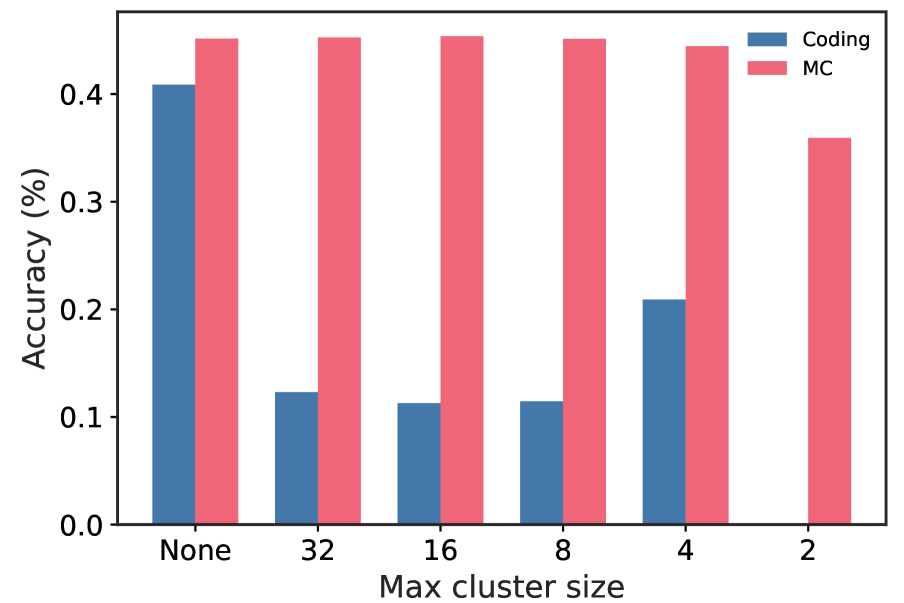
The bar chart compares the accuracy of two clustering algorithms, "Coding" and "MC," across different maximum cluster sizes. The chart shows the percentage accuracy for each algorithm at various cluster sizes.
### Components/Axes
- **X-axis**: Maximum cluster size, ranging from 2 to 32.
- **Y-axis**: Accuracy (%), ranging from 0.0 to 0.4.
- **Legend**: Two categories, "Coding" (blue) and "MC" (red).
### Detailed Analysis or ### Content Details
| Cluster Size | Coding Accuracy | MC Accuracy |
|--------------|-----------------|-------------|
| 32 | 0.4% | 0.4% |
| 16 | 0.1% | 0.4% |
| 8 | 0.1% | 0.4% |
| 4 | 0.2% | 0.4% |
| 2 | 0.2% | 0.3% |
### Key Observations
- The "MC" algorithm consistently outperforms the "Coding" algorithm across all cluster sizes.
- The accuracy of both algorithms decreases as the maximum cluster size increases.
- There is a noticeable drop in accuracy for both algorithms when the maximum cluster size is 2.
### Interpretation
The data suggests that the "MC" algorithm is more effective in clustering tasks compared to the "Coding" algorithm, especially as the maximum cluster size increases. The "MC" algorithm maintains a higher accuracy rate, indicating better performance in handling larger clusters. The decrease in accuracy for both algorithms with larger cluster sizes could be due to increased complexity and computational demands of clustering larger datasets.