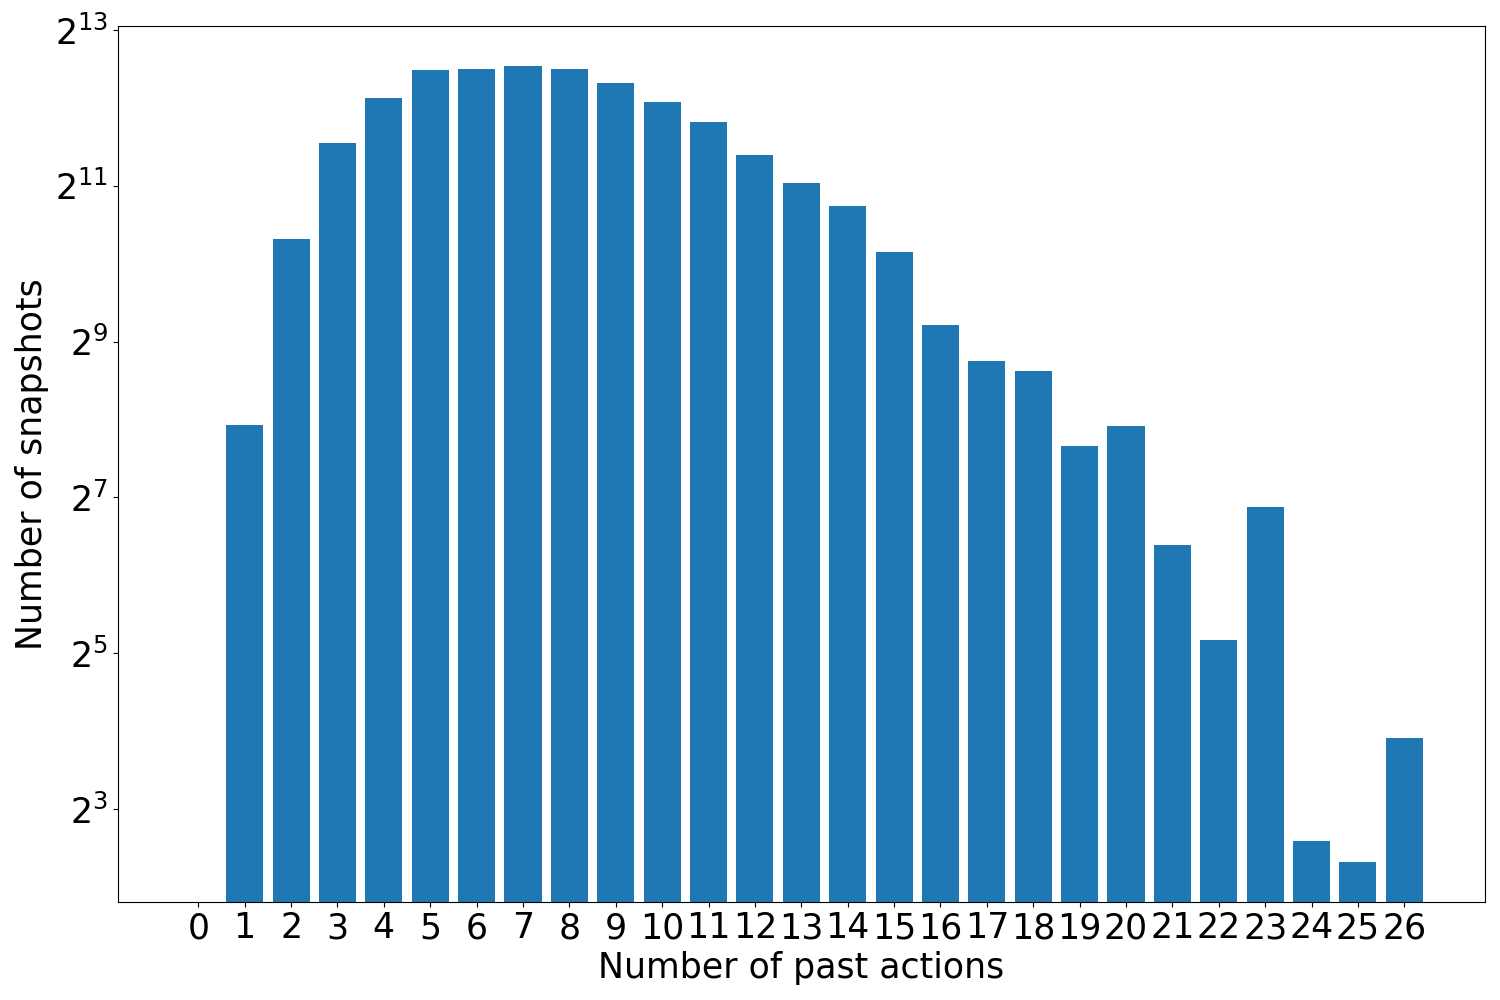
## Bar Chart: Number of Snapshots vs. Number of Past Actions
### Overview
The image is a bar chart showing the distribution of the number of snapshots taken based on the number of past actions. The x-axis represents the number of past actions, ranging from 0 to 26. The y-axis represents the number of snapshots, displayed on a logarithmic scale (base 2). The bars are blue.
### Components/Axes
* **X-axis:** "Number of past actions" with integer values from 0 to 26.
* **Y-axis:** "Number of snapshots" with a logarithmic scale (base 2). The y-axis markers are 2<sup>3</sup>, 2<sup>5</sup>, 2<sup>7</sup>, 2<sup>9</sup>, 2<sup>11</sup>, and 2<sup>13</sup>.
### Detailed Analysis
The bar chart shows the number of snapshots for each number of past actions.
* **Number of past actions = 0:** Number of snapshots is approximately 2<sup>7</sup> (128).
* **Number of past actions = 1:** Number of snapshots is approximately 2<sup>8</sup> (256).
* **Number of past actions = 2:** Number of snapshots is approximately 2<sup>10</sup> (1024).
* **Number of past actions = 3:** Number of snapshots is approximately 2<sup>11</sup> (2048).
* **Number of past actions = 4 to 9:** Number of snapshots is approximately 2<sup>12</sup> (4096).
* **Number of past actions = 10:** Number of snapshots is approximately 2<sup>12</sup> (4096).
* **Number of past actions = 11:** Number of snapshots is approximately 2<sup>12</sup> (4096).
* **Number of past actions = 12:** Number of snapshots is approximately 2<sup>12</sup> (4096).
* **Number of past actions = 13:** Number of snapshots is approximately 2<sup>11.5</sup> (2896).
* **Number of past actions = 14:** Number of snapshots is approximately 2<sup>11</sup> (2048).
* **Number of past actions = 15:** Number of snapshots is approximately 2<sup>10.5</sup> (1448).
* **Number of past actions = 16:** Number of snapshots is approximately 2<sup>10</sup> (1024).
* **Number of past actions = 17:** Number of snapshots is approximately 2<sup>9.5</sup> (724).
* **Number of past actions = 18:** Number of snapshots is approximately 2<sup>9</sup> (512).
* **Number of past actions = 19:** Number of snapshots is approximately 2<sup>8.5</sup> (362).
* **Number of past actions = 20:** Number of snapshots is approximately 2<sup>8</sup> (256).
* **Number of past actions = 21:** Number of snapshots is approximately 2<sup>7.5</sup> (181).
* **Number of past actions = 22:** Number of snapshots is approximately 2<sup>6.5</sup> (90).
* **Number of past actions = 23:** Number of snapshots is approximately 2<sup>7</sup> (128).
* **Number of past actions = 24:** Number of snapshots is approximately 2<sup>4</sup> (16).
* **Number of past actions = 25:** Number of snapshots is approximately 2<sup>4</sup> (16).
* **Number of past actions = 26:** Number of snapshots is approximately 2<sup>3</sup> (8).
### Key Observations
* The number of snapshots increases rapidly from 0 to 4 past actions.
* The number of snapshots plateaus between 4 and 12 past actions.
* The number of snapshots decreases gradually from 12 to 26 past actions.
* There is a significant drop in the number of snapshots after 20 past actions.
### Interpretation
The data suggests that the number of snapshots taken is highest when the number of past actions is between 4 and 12. This could indicate an optimal range for taking snapshots in the system being analyzed. The decrease in snapshots after 12 past actions might be due to a change in behavior, resource constraints, or other factors that limit the number of snapshots taken. The initial increase likely reflects a learning or exploration phase, while the later decrease might reflect a more stable or optimized state. The logarithmic scale emphasizes the relative changes in the number of snapshots.