## Bar Chart: Performance Comparison of LLM Models Across Task Categories
### Overview
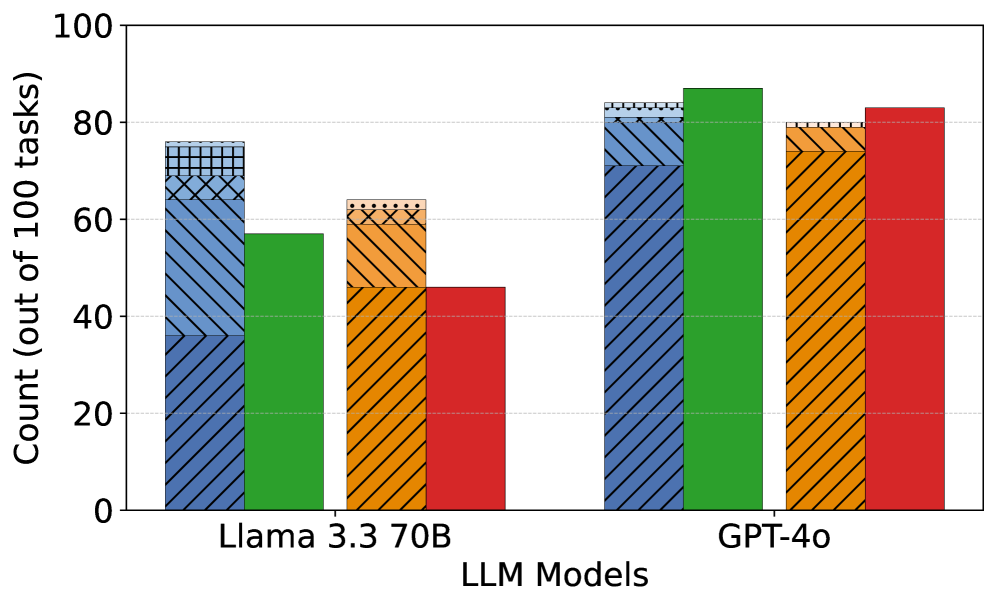
The chart compares the performance of two large language models (Llama 3.3 70B and GPT-4o) across four task categories: Accuracy, Efficiency, Creativity, and Robustness. Performance is measured as a percentage of tasks successfully completed out of 100.
### Components/Axes
- **X-axis**: LLM Models (Llama 3.3 70B, GPT-4o)
- **Y-axis**: Count (out of 100 tasks), scaled from 0 to 100
- **Legend**: Located on the right side, associating colors/patterns with task categories:
- **Accuracy**: Blue (diagonal stripes)
- **Efficiency**: Green (solid)
- **Creativity**: Orange (diagonal stripes)
- **Robustness**: Red (solid)
- **Bar Patterns**: Diagonal stripes (Accuracy/Creativity) vs. solid fills (Efficiency/Robustness)
### Detailed Analysis
#### Llama 3.3 70B
- **Accuracy**: ~35 tasks (blue diagonal stripes)
- **Efficiency**: ~58 tasks (green solid)
- **Creativity**: ~45 tasks (orange diagonal stripes)
- **Robustness**: ~47 tasks (red solid)
#### GPT-4o
- **Accuracy**: ~70 tasks (blue diagonal stripes)
- **Efficiency**: ~85 tasks (green solid)
- **Creativity**: ~75 tasks (orange diagonal stripes)
- **Robustness**: ~82 tasks (red solid)
### Key Observations
1. **Performance Gaps**: GPT-4o consistently outperforms Llama 3.3 70B in all categories.
2. **Largest Disparity**: Efficiency (GPT-4o: 85 vs. Llama: 58) and Robustness (GPT-4o: 82 vs. Llama: 47) show the most significant differences.
3. **Pattern Consistency**: Diagonal stripes (Accuracy/Creativity) and solid fills (Efficiency/Robustness) align precisely with the legend.
### Interpretation
The data demonstrates that GPT-4o exhibits superior capabilities across all evaluated tasks compared to Llama 3.3 70B. The most pronounced advantages are in Efficiency and Robustness, suggesting architectural or training optimizations in GPT-4o that enable better resource utilization and reliability. These findings could inform deployment decisions for applications prioritizing task completion rates and system stability. The consistent pattern alignment confirms the chart's visual encoding accurately represents the underlying data.