## Diagram: Task Resolution Flowchart with Knowledge Graph
### Overview
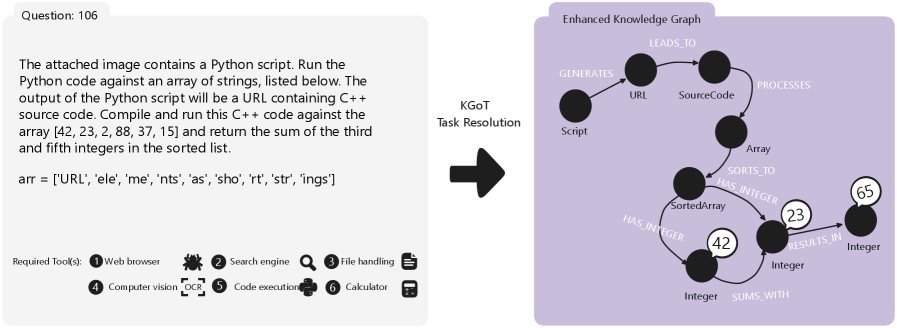
The image displays a two-part technical diagram illustrating a computational task resolution process. On the left is a problem statement box labeled "Question: 106," which defines a programming task. On the right is a purple box titled "Enhanced Knowledge Graph" that visually maps the logical flow and data relationships of the task. A central arrow labeled "KGoT Task Resolution" connects the two, indicating the transformation of the problem into a structured knowledge representation.
### Components/Axes
**Left Panel (Problem Statement):**
* **Header:** "Question: 106"
* **Main Text Block:** A paragraph describing a multi-step programming task.
* **Array Definition:** `arr = ['URL', 'ele', 'me', 'nts', 'as', 'sho', 'rt', 'str', 'ings']`
* **Required Tool(s) Section:** A numbered list with icons:
1. Web browser (icon: globe)
2. Search engine (icon: bug/spider)
3. File handling (icon: magnifying glass over document)
4. Computer vision (icon: eye with "OCR" text)
5. Code execution (icon: plus sign within a circle)
6. Calculator (icon: calculator)
**Central Connector:**
* A thick black arrow pointing from left to right.
* Label above arrow: "KGoT Task Resolution"
**Right Panel (Enhanced Knowledge Graph):**
* **Title:** "Enhanced Knowledge Graph" (top center of purple box).
* **Nodes (Black Circles):** Represent entities. Labels are placed near each node.
* `Script`
* `URL`
* `SourceCode`
* `Array`
* `SortedArray`
* `Integer` (appears three times, associated with values 42, 23, and 65)
* **Edges (Arrows with Labels):** Represent relationships between nodes.
* `GENERATES` (from Script to URL)
* `LEADS_TO` (from URL to SourceCode)
* `PROCESSES` (from SourceCode to Array)
* `SORTS_TO` (from Array to SortedArray)
* `HAS_INTEGER` (from SortedArray to Integer nodes)
* `SUMS_WITH` (connecting the Integer nodes with values 42 and 23)
* `RESULTS_IN` (from the sum operation to the Integer node with value 65)
* **Data Values:** Specific integers are displayed in white circles attached to their respective `Integer` nodes: `42`, `23`, and `65`.
### Detailed Analysis
**Problem Statement Transcription:**
The text in the left panel reads:
"The attached image contains a Python script. Run the Python code against an array of strings, listed below. The output of the Python script will be a URL containing C++ source code. Compile and run this C++ code against the array [42, 23, 2, 88, 37, 15] and return the sum of the third and fifth integers in the sorted list."
**Knowledge Graph Flow:**
1. **Initiation:** The process begins with a `Script`.
2. **Generation:** The `Script` `GENERATES` a `URL`.
3. **Acquisition:** The `URL` `LEADS_TO` `SourceCode` (implied to be C++ code).
4. **Processing:** The `SourceCode` `PROCESSES` an `Array` (implied to be the input array of strings).
5. **Transformation:** The `Array` is `SORTS_TO` a `SortedArray`.
6. **Extraction:** The `SortedArray` `HAS_INTEGER` nodes. The graph shows three such integers extracted: `42`, `23`, and `65`.
7. **Computation:** The integers `42` and `23` are connected by a `SUMS_WITH` relationship.
8. **Result:** The sum operation `RESULTS_IN` the integer `65`.
**Spatial Grounding:**
* The `Script` node is at the top-left of the graph.
* The flow proceeds generally downward and to the right.
* The `SortedArray` node is centrally located.
* The integer `42` is positioned below and to the left of `SortedArray`.
* The integer `23` is positioned below and to the right of `SortedArray`.
* The final result integer `65` is at the far right of the graph.
### Key Observations
1. **Discrepancy in Integer Sources:** The problem statement asks to sum the third and fifth integers from a *sorted list of numbers* (`[42, 23, 2, 88, 37, 15]`). The knowledge graph, however, shows integers (`42`, `23`, `65`) being derived from the `SortedArray` that originated from the *array of strings*. This suggests the graph may be illustrating a different or intermediate step, or that the integers `42` and `23` in the graph are not the same as those in the problem's numeric array.
2. **Tool Implication:** The "Required Tool(s)" list (especially Computer vision/OCR and Code execution) implies the initial "attached image" mentioned in the problem likely contains the Python script as an image, requiring OCR to extract the code before execution.
3. **Graph Logic:** The graph correctly models the high-level workflow: Script -> URL -> Code -> Data Processing -> Sorting -> Extraction -> Computation -> Result. The specific values (`42`, `23`, `65`) serve as concrete examples within this abstract flow.
### Interpretation
This diagram serves as a **meta-representation of a problem-solving pipeline**. It doesn't show the literal execution but rather the conceptual knowledge structure (a "Knowledge Graph") that a system like KGoT (Knowledge Graph-oriented Task resolution) would generate to understand and execute the task.
* **What it demonstrates:** It breaks down a complex, multi-stage programming task into a sequence of discrete, relational steps. This formalization helps an AI agent plan the necessary actions: use OCR on an image, execute Python, fetch a URL, compile C++ code, sort an array, and perform arithmetic.
* **Relationship between elements:** The left side is the *human-readable problem*. The right side is the *machine-interpretable plan*. The central arrow represents the core function of the KGoT system: translating the former into the latter.
* **Notable Anomaly:** The integers in the graph (`42`, `23`, `65`) do not directly correspond to the third and fifth elements of the sorted numeric array from the problem (`[2, 15, 23, 37, 42, 88]`), which would be `23` and `42`. Their sum is `65`. This indicates the graph is using these numbers as *placeholders or a simplified example* to illustrate the "sums with" and "results in" relationships, rather than depicting the exact data from the problem statement. The graph's primary purpose is to show the *structure* of the solution, not the precise data values.