## Line Chart: Accuracy vs. Sample Size
### Overview
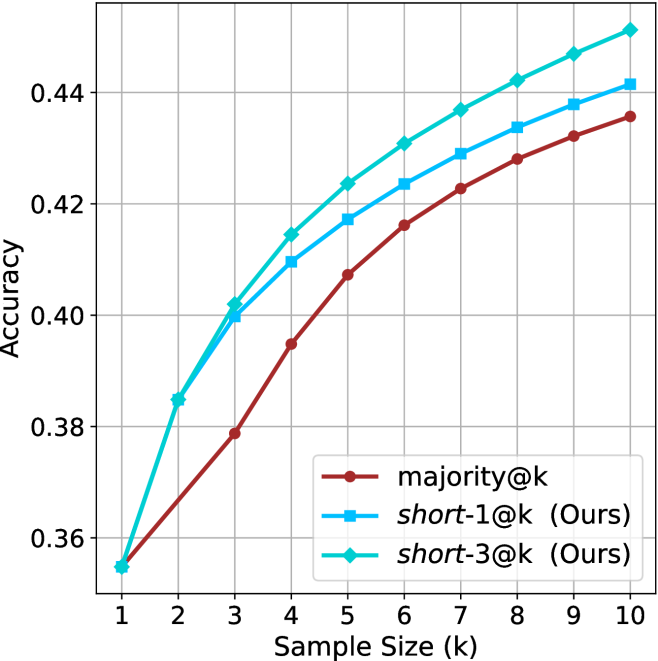
The image is a line chart comparing the accuracy of three different methods ("majority@k", "short-1@k (Ours)", and "short-3@k (Ours)") as a function of sample size (k), which ranges from 1 to 10. The chart displays how accuracy increases with sample size for each method.
### Components/Axes
* **X-axis:** Sample Size (k), with integer values from 1 to 10.
* **Y-axis:** Accuracy, ranging from 0.36 to 0.44, with gridlines at intervals of 0.02.
* **Legend:** Located in the bottom-right corner, it identifies the three methods:
* Brown line with circle markers: "majority@k"
* Blue line with square markers: "short-1@k (Ours)"
* Cyan line with diamond markers: "short-3@k (Ours)"
### Detailed Analysis
* **majority@k (Brown line, circle markers):**
* The line starts at approximately 0.355 at k=1 and increases steadily.
* At k=2, the accuracy is approximately 0.378.
* At k=3, the accuracy is approximately 0.398.
* At k=4, the accuracy is approximately 0.405.
* At k=5, the accuracy is approximately 0.408.
* At k=6, the accuracy is approximately 0.423.
* At k=7, the accuracy is approximately 0.428.
* At k=8, the accuracy is approximately 0.432.
* At k=9, the accuracy is approximately 0.436.
* At k=10, the accuracy is approximately 0.440.
* The trend is upward, with the rate of increase slowing as k increases.
* **short-1@k (Ours) (Blue line, square markers):**
* The line starts at approximately 0.355 at k=1 and increases steadily.
* At k=2, the accuracy is approximately 0.385.
* At k=3, the accuracy is approximately 0.400.
* At k=4, the accuracy is approximately 0.410.
* At k=5, the accuracy is approximately 0.418.
* At k=6, the accuracy is approximately 0.423.
* At k=7, the accuracy is approximately 0.430.
* At k=8, the accuracy is approximately 0.433.
* At k=9, the accuracy is approximately 0.438.
* At k=10, the accuracy is approximately 0.442.
* The trend is upward, with the rate of increase slowing as k increases.
* **short-3@k (Ours) (Cyan line, diamond markers):**
* The line starts at approximately 0.355 at k=1 and increases steadily.
* At k=2, the accuracy is approximately 0.385.
* At k=3, the accuracy is approximately 0.400.
* At k=4, the accuracy is approximately 0.410.
* At k=5, the accuracy is approximately 0.420.
* At k=6, the accuracy is approximately 0.430.
* At k=7, the accuracy is approximately 0.435.
* At k=8, the accuracy is approximately 0.438.
* At k=9, the accuracy is approximately 0.442.
* At k=10, the accuracy is approximately 0.445.
* The trend is upward, with the rate of increase slowing as k increases.
### Key Observations
* All three methods show an increase in accuracy as the sample size (k) increases.
* The "short-3@k (Ours)" method generally has the highest accuracy across all sample sizes.
* The "majority@k" method generally has the lowest accuracy across all sample sizes.
* The rate of accuracy increase diminishes as the sample size grows larger for all three methods.
### Interpretation
The chart demonstrates that increasing the sample size (k) generally improves the accuracy of all three methods tested. The "short-3@k (Ours)" method consistently outperforms the other two, suggesting it is the most effective approach among those compared. The diminishing returns observed as k increases indicate that there is a point beyond which increasing the sample size provides only marginal improvements in accuracy. This information is valuable for optimizing the performance of these methods in practical applications, balancing the trade-off between accuracy and computational cost associated with larger sample sizes.