## Line Chart: Accuracy vs. Sample Size (k)
### Overview
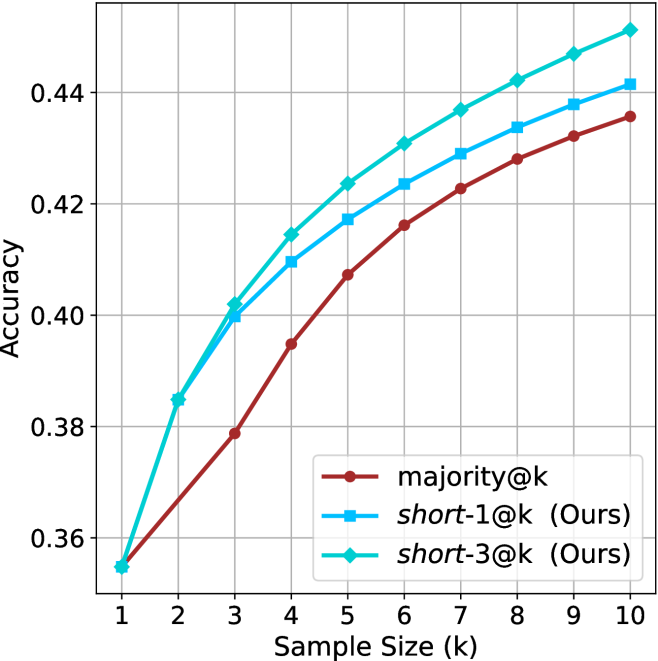
This chart illustrates the performance (Accuracy) of three distinct methods—`majority@k`, `short-1@k (Ours)`, and `short-3@k (Ours)`—as the sample size ($k$) increases from 1 to 10. The chart demonstrates that increasing the sample size consistently improves accuracy for all methods, with the "Ours" methods outperforming the `majority@k` baseline.
### Components/Axes
* **X-Axis:** Labeled "Sample Size (k)". The scale is linear, ranging from 1 to 10, with integer markers.
* **Y-Axis:** Labeled "Accuracy". The scale ranges from 0.36 to 0.44, with grid lines at 0.02 intervals (0.36, 0.38, 0.40, 0.42, 0.44).
* **Legend:** Located in the bottom-right quadrant of the chart area.
* **`majority@k`**: Represented by a dark red line with circular markers.
* **`short-1@k (Ours)`**: Represented by a medium blue line with square markers.
* **`short-3@k (Ours)`**: Represented by a cyan/teal line with diamond markers.
### Detailed Analysis
**Trend Verification:**
All three data series exhibit a positive, monotonic trend (sloping upward) as the sample size ($k$) increases. The rate of improvement appears to be slightly higher at lower values of $k$ (1–4) and begins to show signs of diminishing returns as $k$ approaches 10, though the curves remain upward-sloping.
**Data Point Extraction (Approximate Values):**
| Sample Size (k) | `majority@k` (Red/Circle) | `short-1@k` (Blue/Square) | `short-3@k` (Cyan/Diamond) |
| :--- | :--- | :--- | :--- |
| **1** | ~0.355 | ~0.355 | ~0.355 |
| **2** | ~0.368 | ~0.385 | ~0.385 |
| **3** | ~0.379 | ~0.400 | ~0.402 |
| **4** | ~0.395 | ~0.410 | ~0.415 |
| **5** | ~0.408 | ~0.417 | ~0.424 |
| **6** | ~0.416 | ~0.424 | ~0.431 |
| **7** | ~0.423 | ~0.429 | ~0.437 |
| **8** | ~0.428 | ~0.434 | ~0.442 |
| **9** | ~0.432 | ~0.438 | ~0.447 |
| **10** | ~0.436 | ~0.442 | ~0.452 |
*Note: At $k=1$, all three methods converge at approximately 0.355.*
### Key Observations
* **Performance Hierarchy:** `short-3@k` consistently achieves the highest accuracy across all sample sizes greater than 1. `short-1@k` occupies the middle position, and `majority@k` consistently performs the worst.
* **Divergence:** While all methods start at the same point at $k=1$, the performance gap between the methods widens as $k$ increases.
* **Gap Analysis:** The gap between `short-3@k` and `majority@k` is the most significant, reaching a difference of approximately 0.016 at $k=10$.
### Interpretation
The data demonstrates that the methods labeled "(Ours)" are more effective than the `majority@k` baseline. The fact that `short-3@k` outperforms `short-1@k` suggests that the underlying mechanism (likely involving a larger context or more sophisticated selection process denoted by the "3") provides a tangible benefit in accuracy.
The convergence at $k=1$ is logical, as with a sample size of 1, the methods likely default to the same decision logic (the single most likely item), rendering the specific "short" or "majority" logic irrelevant. As $k$ increases, the methods are able to leverage more information, and the "Ours" methods are clearly better at utilizing this additional data to improve prediction accuracy compared to the standard `majority` approach.