\n
## Diagram: State Transition Diagram
### Overview
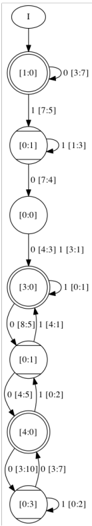
The image depicts a state transition diagram. It shows a series of states represented by ovals, connected by arrows indicating transitions. Each transition is labeled with a '0' or '1' input, followed by a time duration in the format `[hours:minutes]`. The diagram appears to model a system with a sequence of states and time-based transitions triggered by binary inputs.
### Components/Axes
The diagram consists of the following components:
* **States:** Represented by ovals.
* **Transitions:** Represented by arrows connecting states.
* **Transition Labels:** Each arrow is labeled with a binary input (0 or 1) and a time duration.
* **Initial State:** The topmost oval labeled "1".
### Detailed Analysis or Content Details
The diagram can be described as a sequence of states and transitions as follows:
1. **Initial State:** Oval labeled "1".
2. **Transition 1:** From "1" to "[1:5:0]", triggered by input "0" with duration "[3:7]". A loop back to "[1:5:0]" is triggered by input "1" with duration "[7:5]".
3. **Transition 2:** From "[1:5:0]" to "[0:11]", triggered by input "1" with duration "[1:3]". A loop back to "[0:11]" is triggered by input "0" with duration "[17:4]".
4. **Transition 3:** From "[0:11]" to "[0:0]", triggered by input "0" with duration "[17:4]".
5. **Transition 4:** From "[0:0]" to "[3:0]", triggered by input "0" with duration "[4:3]". A loop back to "[3:0]" is triggered by input "1" with duration "[3:1]".
6. **Transition 5:** From "[3:0]" to "[10:11]", triggered by input "0" with duration "[8:5]". A loop back to "[10:11]" is triggered by input "1" with duration "[4:1]".
7. **Transition 6:** From "[10:11]" to "[4:0]", triggered by input "0" with duration "[4:5]". A loop back to "[4:0]" is triggered by input "1" with duration "[0:2]".
8. **Transition 7:** From "[4:0]" to "[0:3]", triggered by input "0" with duration "[13:10]". A loop back to "[0:3]" is triggered by input "1" with duration "[3:7]".
### Key Observations
* The diagram represents a deterministic finite automaton (DFA) or a state machine.
* The time durations associated with transitions vary significantly, ranging from seconds to hours.
* Each state has at least one incoming and one outgoing transition.
* The diagram does not have a clear "final" or "accepting" state. It appears to be a continuous loop.
### Interpretation
The diagram likely models a system that responds to binary inputs ("0" and "1") and transitions between different states over time. The time durations associated with each transition could represent the amount of time the system remains in a particular state before responding to the next input. The absence of a final state suggests that the system operates continuously, cycling through its states based on the input sequence. The varying time durations could represent different processing times or delays within the system. The diagram could represent a control system, a communication protocol, or a behavioral model of a complex system. Without further context, it is difficult to determine the specific application of this state transition diagram. The durations are likely in the format `hours:minutes`.