## Bar Chart: CoC (Python)
### Overview
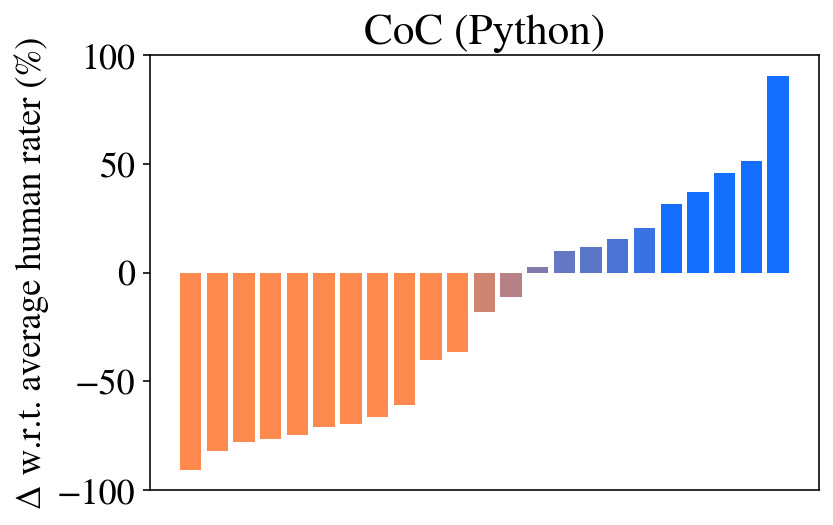
The image is a bar chart titled "CoC (Python)". The chart displays the difference in performance compared to the average human rater, represented as a percentage. The x-axis represents different categories (unspecified), and the y-axis represents the delta with respect to the average human rater (%). The bars are colored in shades of orange and blue, indicating negative and positive differences, respectively.
### Components/Axes
* **Title:** CoC (Python)
* **Y-axis Label:** Δ w.r.t. average human rater (%)
* **Y-axis Scale:** -100 to 100, with markers at -100, -50, 0, 50, and 100.
* **X-axis:** No explicit label, but represents different categories.
* **Bar Colors:** Orange (negative values), Blue (positive values), and a gradient between orange and blue for values near zero.
### Detailed Analysis
The chart consists of a series of vertical bars. The bars on the left side of the chart are orange, indicating a negative difference compared to the average human rater. As we move from left to right, the bars transition to a gradient between orange and blue, then to blue, indicating a positive difference.
Here's a breakdown of approximate values for some of the bars:
* **Leftmost Orange Bar:** Approximately -90%
* **Middle Orange Bar:** Approximately -60%
* **Bar closest to zero (Orange-Blue Gradient):** Approximately -10%
* **First Blue Bar:** Approximately 5%
* **Rightmost Blue Bar:** Approximately 95%
The bars generally show a trend of increasing values from left to right.
### Key Observations
* A significant portion of the categories show a negative difference compared to the average human rater.
* The rightmost categories show a substantial positive difference, indicating better performance than the average human rater.
* There is a clear transition from negative to positive differences as we move across the categories.
### Interpretation
The bar chart compares the performance of a system (likely an AI model) against the average human rater across different categories. The "CoC (Python)" title suggests this system is related to "Chain of Command" or "Code of Conduct" implemented in Python. The negative values indicate categories where the system underperforms compared to human raters, while the positive values indicate categories where it outperforms them. The chart highlights the strengths and weaknesses of the system, showing where it excels and where it needs improvement. The transition from negative to positive differences suggests that the system's performance varies significantly across different categories.