## Stacked Bar Chart: Rating Distribution by Model
### Overview
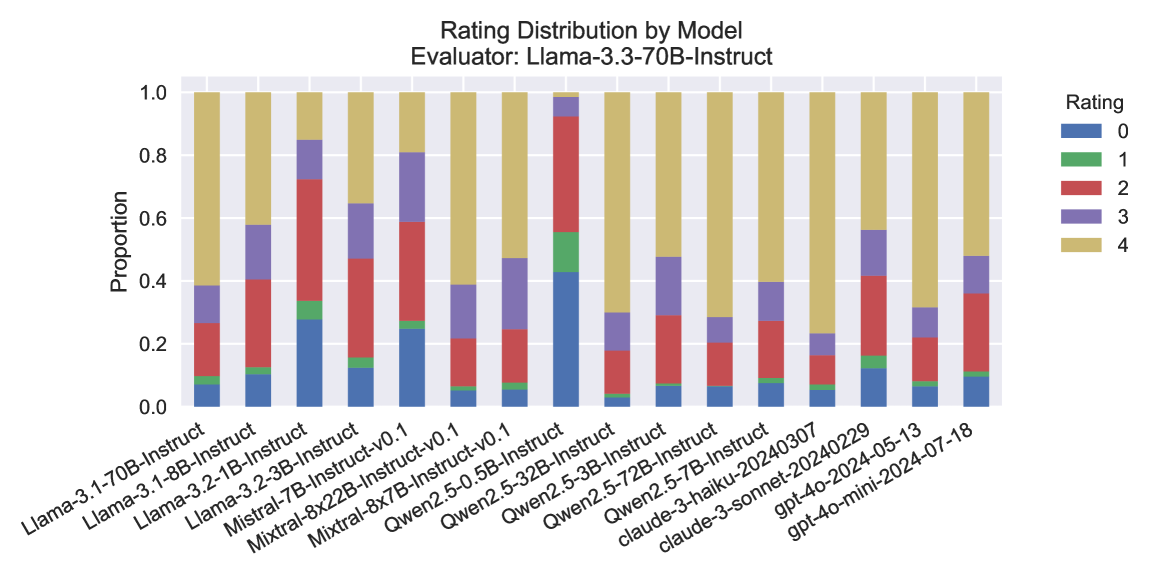
The image is a stacked bar chart showing the distribution of ratings for different language models, as evaluated by Llama-3.3-70B-Instruct. Each bar represents a model, and the bar is segmented into colored sections representing the proportion of each rating (0 to 4).
### Components/Axes
* **Title:** Rating Distribution by Model
* **Subtitle:** Evaluator: Llama-3.3-70B-Instruct
* **Y-axis:** Proportion, ranging from 0.0 to 1.0 in increments of 0.2.
* **X-axis:** Language models, including:
* Llama-3.1-70B-Instruct
* Llama-3.1-8B-Instruct
* Llama-3.2-1B-Instruct
* Llama-3.2-3B-Instruct
* Mistral-7B-Instruct-v0.1
* Mixtral-8x22B-Instruct-v0.1
* Mixtral-8x7B-Instruct-v0.1
* Qwen2.5-0.5B-Instruct
* Qwen2.5-32B-Instruct
* Qwen2.5-3B-Instruct
* Qwen2.5-72B-Instruct
* Qwen2.5-7B-Instruct
* claude-3-haiku-20240307
* claude-3-sonnet-20240229
* gpt-4o-2024-05-13
* gpt-4o-mini-2024-07-18
* **Legend (Top-Right):**
* Blue: 0
* Green: 1
* Red: 2
* Purple: 3
* Tan/Beige: 4
### Detailed Analysis
The chart displays the proportion of each rating (0-4) assigned to different language models by the Llama-3.3-70B-Instruct evaluator. Each model has a stacked bar representing its rating distribution.
* **Llama-3.1-70B-Instruct:** Approximately 10% rating 0, 5% rating 1, 25% rating 2, 20% rating 3, and 40% rating 4.
* **Llama-3.1-8B-Instruct:** Approximately 12% rating 0, 3% rating 1, 25% rating 2, 15% rating 3, and 45% rating 4.
* **Llama-3.2-1B-Instruct:** Approximately 10% rating 0, 5% rating 1, 20% rating 2, 25% rating 3, and 40% rating 4.
* **Llama-3.2-3B-Instruct:** Approximately 10% rating 0, 25% rating 2, 20% rating 3, and 45% rating 4.
* **Mistral-7B-Instruct-v0.1:** Approximately 25% rating 0, 10% rating 1, 35% rating 2, 20% rating 3, and 10% rating 4.
* **Mixtral-8x22B-Instruct-v0.1:** Approximately 10% rating 0, 5% rating 1, 25% rating 2, 30% rating 3, and 30% rating 4.
* **Mixtral-8x7B-Instruct-v0.1:** Approximately 10% rating 0, 5% rating 1, 25% rating 2, 20% rating 3, and 40% rating 4.
* **Qwen2.5-0.5B-Instruct:** Approximately 40% rating 0, 10% rating 1, 30% rating 2, 15% rating 3, and 5% rating 4.
* **Qwen2.5-32B-Instruct:** Approximately 10% rating 0, 5% rating 1, 20% rating 2, 30% rating 3, and 35% rating 4.
* **Qwen2.5-3B-Instruct:** Approximately 50% rating 0, 5% rating 1, 20% rating 2, 20% rating 3, and 5% rating 4.
* **Qwen2.5-72B-Instruct:** Approximately 10% rating 0, 5% rating 1, 10% rating 2, 20% rating 3, and 55% rating 4.
* **Qwen2.5-7B-Instruct:** Approximately 10% rating 0, 5% rating 1, 35% rating 2, 30% rating 3, and 20% rating 4.
* **claude-3-haiku-20240307:** Approximately 5% rating 0, 5% rating 1, 10% rating 2, 20% rating 3, and 60% rating 4.
* **claude-3-sonnet-20240229:** Approximately 5% rating 0, 5% rating 1, 20% rating 2, 20% rating 3, and 50% rating 4.
* **gpt-4o-2024-05-13:** Approximately 10% rating 0, 5% rating 1, 35% rating 2, 20% rating 3, and 30% rating 4.
* **gpt-4o-mini-2024-07-18:** Approximately 10% rating 0, 5% rating 1, 30% rating 2, 5% rating 3, and 50% rating 4.
### Key Observations
* The Qwen2.5-3B-Instruct model has the highest proportion of rating 0.
* The claude-3-haiku-20240307 model has the highest proportion of rating 4.
* The distribution of ratings varies significantly across different models.
### Interpretation
The stacked bar chart provides a visual comparison of how different language models are rated by the Llama-3.3-70B-Instruct evaluator. The distribution of ratings for each model gives insight into the evaluator's perception of the model's performance. Models like Qwen2.5-3B-Instruct receive a higher proportion of lower ratings (0), suggesting they may not perform as well as models like claude-3-haiku-20240307, which receives a higher proportion of higher ratings (4). The chart highlights the variability in performance across different models and can be used to identify models that may require further improvement or investigation.