TECHNICAL ASSET FINGERPRINT
6bd9206d03140f5b631de7be
Click to view fullscreen
Press ESC or click to close
FOUND IN PAPERS
EXPERT: gemini-2.5-flash-lite-free VERSION 1
RUNTIME: google-free/gemini-2.5-flash-lite
INTEL_VERIFIED
## Stacked Bar Chart: Rating Distribution by Model
### Overview
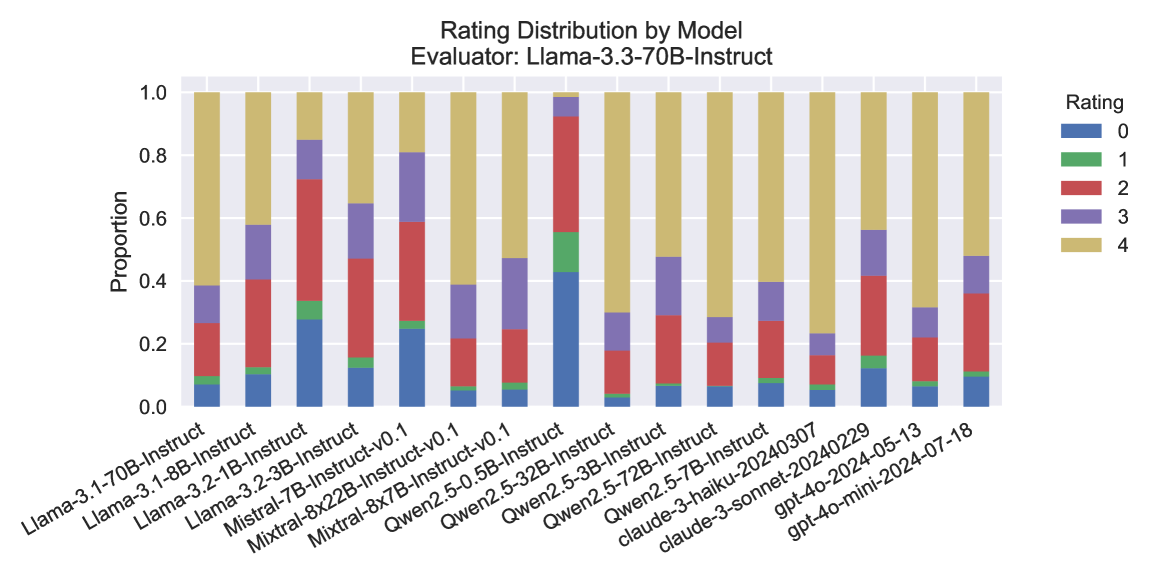
This stacked bar chart displays the distribution of ratings (0 through 4) for various language models, as evaluated by "Llama-3.3-70B-Instruct". Each bar represents a specific model, and the segments within the bar indicate the proportion of responses that received each rating. The chart allows for a visual comparison of how different models perform according to the evaluator.
### Components/Axes
* **Title:** "Rating Distribution by Model"
* **Subtitle:** "Evaluator: Llama-3.3-70B-Instruct"
* **Y-axis Title:** "Proportion"
* **Y-axis Scale:** Ranges from 0.0 to 1.0, representing proportions from 0% to 100%. Major ticks are at 0.0, 0.2, 0.4, 0.6, 0.8, and 1.0.
* **X-axis Labels:** These are the names of the evaluated models. They are rotated for readability and include:
* Llama-3.1-70B-Instruct
* Llama-3.1-8B-Instruct
* Llama-3.2-1B-Instruct
* Llama-3.2-3B-Instruct
* Mistral-7B-Instruct
* Mistral-8x22B-Instruct-v0.1
* Qwen2.5-0.5B-Instruct-v0.1
* Qwen2.5-32B-Instruct
* Qwen2.5-72B-Instruct
* claude-3-haiku-20240307
* claude-3-sonnet-20240229
* gpt-4o-mini-20240513
* gpt-4o-2024-07-18
* **Legend:** Located in the top-right corner of the chart. It maps colors to rating values:
* Blue: Rating 0
* Green: Rating 1
* Red: Rating 2
* Purple: Rating 3
* Yellow: Rating 4
### Detailed Analysis
The chart displays 13 different models. For each model, the bar is segmented from bottom to top, representing the cumulative proportion of ratings from 0 to 4.
* **Llama-3.1-70B-Instruct:**
* Rating 0 (Blue): ~0.08
* Rating 1 (Green): ~0.02 (cumulative ~0.10)
* Rating 2 (Red): ~0.15 (cumulative ~0.25)
* Rating 3 (Purple): ~0.15 (cumulative ~0.40)
* Rating 4 (Yellow): ~0.60 (cumulative ~1.00)
* Trend: Starts with a moderate proportion of low ratings, then a significant portion of high ratings.
* **Llama-3.1-8B-Instruct:**
* Rating 0 (Blue): ~0.05
* Rating 1 (Green): ~0.01 (cumulative ~0.06)
* Rating 2 (Red): ~0.20 (cumulative ~0.26)
* Rating 3 (Purple): ~0.34 (cumulative ~0.60)
* Rating 4 (Yellow): ~0.40 (cumulative ~1.00)
* Trend: Similar to the previous model, but with a higher proportion of ratings 2 and 3, and a lower proportion of rating 4.
* **Llama-3.2-1B-Instruct:**
* Rating 0 (Blue): ~0.18
* Rating 1 (Green): ~0.01 (cumulative ~0.19)
* Rating 2 (Red): ~0.15 (cumulative ~0.34)
* Rating 3 (Purple): ~0.26 (cumulative ~0.60)
* Rating 4 (Yellow): ~0.40 (cumulative ~1.00)
* Trend: Higher proportion of rating 0 compared to the previous two Llama models.
* **Llama-3.2-3B-Instruct:**
* Rating 0 (Blue): ~0.10
* Rating 1 (Green): ~0.01 (cumulative ~0.11)
* Rating 2 (Red): ~0.12 (cumulative ~0.23)
* Rating 3 (Purple): ~0.17 (cumulative ~0.40)
* Rating 4 (Yellow): ~0.60 (cumulative ~1.00)
* Trend: A relatively balanced distribution across ratings 0-3, with a strong majority in rating 4.
* **Mistral-7B-Instruct:**
* Rating 0 (Blue): ~0.23
* Rating 1 (Green): ~0.01 (cumulative ~0.24)
* Rating 2 (Red): ~0.17 (cumulative ~0.41)
* Rating 3 (Purple): ~0.19 (cumulative ~0.60)
* Rating 4 (Yellow): ~0.40 (cumulative ~1.00)
* Trend: Higher proportion of rating 0 than previous Llama models.
* **Mistral-8x22B-Instruct-v0.1:**
* Rating 0 (Blue): ~0.15
* Rating 1 (Green): ~0.01 (cumulative ~0.16)
* Rating 2 (Red): ~0.10 (cumulative ~0.26)
* Rating 3 (Purple): ~0.57 (cumulative ~0.83)
* Rating 4 (Yellow): ~0.17 (cumulative ~1.00)
* Trend: This model shows a significantly higher proportion of rating 3 and a much lower proportion of rating 4 compared to most other models.
* **Qwen2.5-0.5B-Instruct-v0.1:**
* Rating 0 (Blue): ~0.10
* Rating 1 (Green): ~0.01 (cumulative ~0.11)
* Rating 2 (Red): ~0.12 (cumulative ~0.23)
* Rating 3 (Purple): ~0.17 (cumulative ~0.40)
* Rating 4 (Yellow): ~0.60 (cumulative ~1.00)
* Trend: Similar distribution to Llama-3.2-3B-Instruct, with a strong majority in rating 4.
* **Qwen2.5-32B-Instruct:**
* Rating 0 (Blue): ~0.08
* Rating 1 (Green): ~0.01 (cumulative ~0.09)
* Rating 2 (Red): ~0.10 (cumulative ~0.19)
* Rating 3 (Purple): ~0.12 (cumulative ~0.31)
* Rating 4 (Yellow): ~0.69 (cumulative ~1.00)
* Trend: This model has the highest proportion of rating 4 among all displayed models.
* **Qwen2.5-72B-Instruct:**
* Rating 0 (Blue): ~0.07
* Rating 1 (Green): ~0.01 (cumulative ~0.08)
* Rating 2 (Red): ~0.10 (cumulative ~0.18)
* Rating 3 (Purple): ~0.15 (cumulative ~0.33)
* Rating 4 (Yellow): ~0.67 (cumulative ~1.00)
* Trend: Very similar to Qwen2.5-32B-Instruct, with a very high proportion of rating 4.
* **claude-3-haiku-20240307:**
* Rating 0 (Blue): ~0.10
* Rating 1 (Green): ~0.01 (cumulative ~0.11)
* Rating 2 (Red): ~0.15 (cumulative ~0.26)
* Rating 3 (Purple): ~0.20 (cumulative ~0.46)
* Rating 4 (Yellow): ~0.54 (cumulative ~1.00)
* Trend: A moderate distribution, with a good proportion of rating 4.
* **claude-3-sonnet-20240229:**
* Rating 0 (Blue): ~0.07
* Rating 1 (Green): ~0.01 (cumulative ~0.08)
* Rating 2 (Red): ~0.10 (cumulative ~0.18)
* Rating 3 (Purple): ~0.15 (cumulative ~0.33)
* Rating 4 (Yellow): ~0.67 (cumulative ~1.00)
* Trend: Similar to Qwen2.5-72B-Instruct, with a high proportion of rating 4.
* **gpt-4o-mini-20240513:**
* Rating 0 (Blue): ~0.12
* Rating 1 (Green): ~0.01 (cumulative ~0.13)
* Rating 2 (Red): ~0.10 (cumulative ~0.23)
* Rating 3 (Purple): ~0.10 (cumulative ~0.33)
* Rating 4 (Yellow): ~0.67 (cumulative ~1.00)
* Trend: A relatively even distribution across ratings 0-3, with a strong majority in rating 4.
* **gpt-4o-2024-07-18:**
* Rating 0 (Blue): ~0.10
* Rating 1 (Green): ~0.01 (cumulative ~0.11)
* Rating 2 (Red): ~0.25 (cumulative ~0.36)
* Rating 3 (Purple): ~0.15 (cumulative ~0.51)
* Rating 4 (Yellow): ~0.49 (cumulative ~1.00)
* Trend: This model has a notably higher proportion of rating 2 compared to many others, and a slightly lower proportion of rating 4.
### Key Observations
* **Dominance of Rating 4:** The majority of models show a substantial proportion of responses receiving a rating of 4 (yellow segment), indicating generally high performance as judged by the evaluator.
* **Qwen2.5 Models Excel:** The Qwen2.5 models (0.5B, 32B, and 72B) and the claude-3-sonnet model appear to achieve the highest proportions of rating 4, with Qwen2.5-32B-Instruct and Qwen2.5-72B-Instruct showing the largest yellow segments (approximately 69% and 67% respectively).
* **Mistral-8x22B-Instruct Anomaly:** Mistral-8x22B-Instruct-v0.1 stands out with a significantly higher proportion of rating 3 (purple segment, ~57%) and a considerably lower proportion of rating 4 (~17%) compared to most other models.
* **gpt-4o-2024-07-18 Variation:** This model shows a higher proportion of rating 2 (red segment, ~25%) than many other models, and a slightly lower proportion of rating 4.
* **Llama Models:** The Llama models generally show a good distribution, with a significant portion of rating 4, though some variations exist in the proportions of lower ratings. Llama-3.1-70B-Instruct and Llama-3.2-3B-Instruct have a higher proportion of rating 4 compared to Llama-3.1-8B-Instruct and Llama-3.2-1B-Instruct.
* **Rating 0 Proportions:** Most models have a rating 0 proportion between 5% and 15%. Mistral-7B-Instruct and Mistral-8x22B-Instruct-v0.1 have slightly higher proportions of rating 0 (around 23% and 15% respectively).
### Interpretation
This chart provides a comparative performance analysis of various language models when evaluated by "Llama-3.3-70B-Instruct". The data suggests that while many models perform well, achieving high ratings, there are distinct differences in their rating distributions.
The prevalence of rating 4 across most models indicates that the evaluator, "Llama-3.3-70B-Instruct", tends to assign high scores, suggesting a generally positive assessment of the evaluated models' outputs. However, the variations in the proportions of ratings 0, 1, 2, and 3 highlight subtle but important differences in how each model's responses are perceived.
The Qwen2.5 family of models, particularly the larger versions (32B and 72B), and claude-3-sonnet appear to be the strongest performers according to this specific evaluator, consistently receiving the highest proportion of top ratings. This suggests that these models might be more aligned with the evaluation criteria or possess capabilities that the evaluator prioritizes.
The outlier, Mistral-8x22B-Instruct-v0.1, with its high proportion of rating 3 and low rating 4, suggests a different performance profile. It might be that its responses are consistently good but not exceptional, or that it struggles with certain aspects that lead to a rating of 4. Similarly, gpt-4o-2024-07-18's higher proportion of rating 2 might indicate a tendency for its responses to be moderately good rather than excellent or poor.
The Llama models show a generally good performance, but the differences between them might reflect variations in their architecture or training data, leading to slightly different response qualities.
In essence, the chart demonstrates that while a high rating is common, the nuances in the distribution of lower ratings can reveal specific strengths and weaknesses of each model as perceived by the "Llama-3.3-70B-Instruct" evaluator. This data is crucial for understanding model capabilities in a comparative context and for identifying models that excel in specific areas or align best with particular evaluation standards.
DECODING INTELLIGENCE...