\n
## Scatter Plot: Confidence vs. Target Length (High School Mathematics)
### Overview
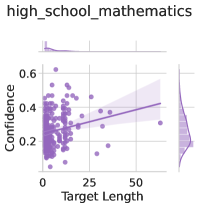
The image presents a scatter plot visualizing the relationship between "Target Length" and "Confidence" for data related to "high_school_mathematics". A regression line with a shaded confidence interval is overlaid on the scatter points. Marginal distributions are shown above and to the right of the main plot.
### Components/Axes
* **Title:** "high\_school\_mathematics" (top-left)
* **X-axis:** "Target Length" (bottom) - Scale ranges from approximately 0 to 60.
* **Y-axis:** "Confidence" (left) - Scale ranges from approximately 0.15 to 0.6.
* **Scatter Points:** Purple dots representing individual data points.
* **Regression Line:** Brown line representing the trend of the data.
* **Confidence Interval:** Light purple shaded area around the regression line.
* **Marginal Distribution (Top):** A density plot showing the distribution of "Target Length".
* **Marginal Distribution (Right):** A density plot showing the distribution of "Confidence".
### Detailed Analysis
The scatter plot shows a generally positive, but weak, correlation between "Target Length" and "Confidence".
* **Scatter Points:** The points are clustered around the x-axis (Target Length near 0) with a concentration of points between 0.2 and 0.4 on the Confidence axis. As Target Length increases, the points become more dispersed.
* **Regression Line:** The brown regression line slopes upward, indicating a positive correlation. The slope appears to be relatively shallow.
* **Confidence Interval:** The confidence interval is relatively wide, suggesting a high degree of uncertainty in the estimated relationship.
* **Marginal Distribution (Top):** The distribution of "Target Length" is skewed to the right, with a peak around a value of approximately 5. There is a long tail extending to higher values.
* **Marginal Distribution (Right):** The distribution of "Confidence" is roughly symmetrical, with a peak around a value of approximately 0.25.
Approximate Data Points (based on visual estimation):
* Target Length = 0, Confidence ranges from ~0.18 to ~0.5
* Target Length = 25, Confidence ranges from ~0.2 to ~0.45
* Target Length = 50, Confidence ranges from ~0.25 to ~0.55
### Key Observations
* The relationship between "Target Length" and "Confidence" is weak.
* There is a significant amount of variability in "Confidence" for a given "Target Length".
* The marginal distributions reveal that "Target Length" is more skewed than "Confidence".
* The confidence interval is wide, indicating uncertainty in the regression model.
### Interpretation
The data suggests that, in the context of high school mathematics, there is a slight tendency for confidence to increase with target length. However, this relationship is not strong, and confidence is likely influenced by many other factors. The wide confidence interval indicates that the observed correlation may not be reliable or generalizable. The skewness of the "Target Length" distribution suggests that most tasks have relatively short target lengths, with a few tasks having much longer lengths. The marginal distributions provide insight into the range and distribution of each variable independently. The overall plot suggests that target length is not a strong predictor of confidence in this dataset. It is possible that other variables, not shown in this plot, are more important determinants of confidence.