## Line Graph: Memory Access Bandwidth vs. N_inflight
### Overview
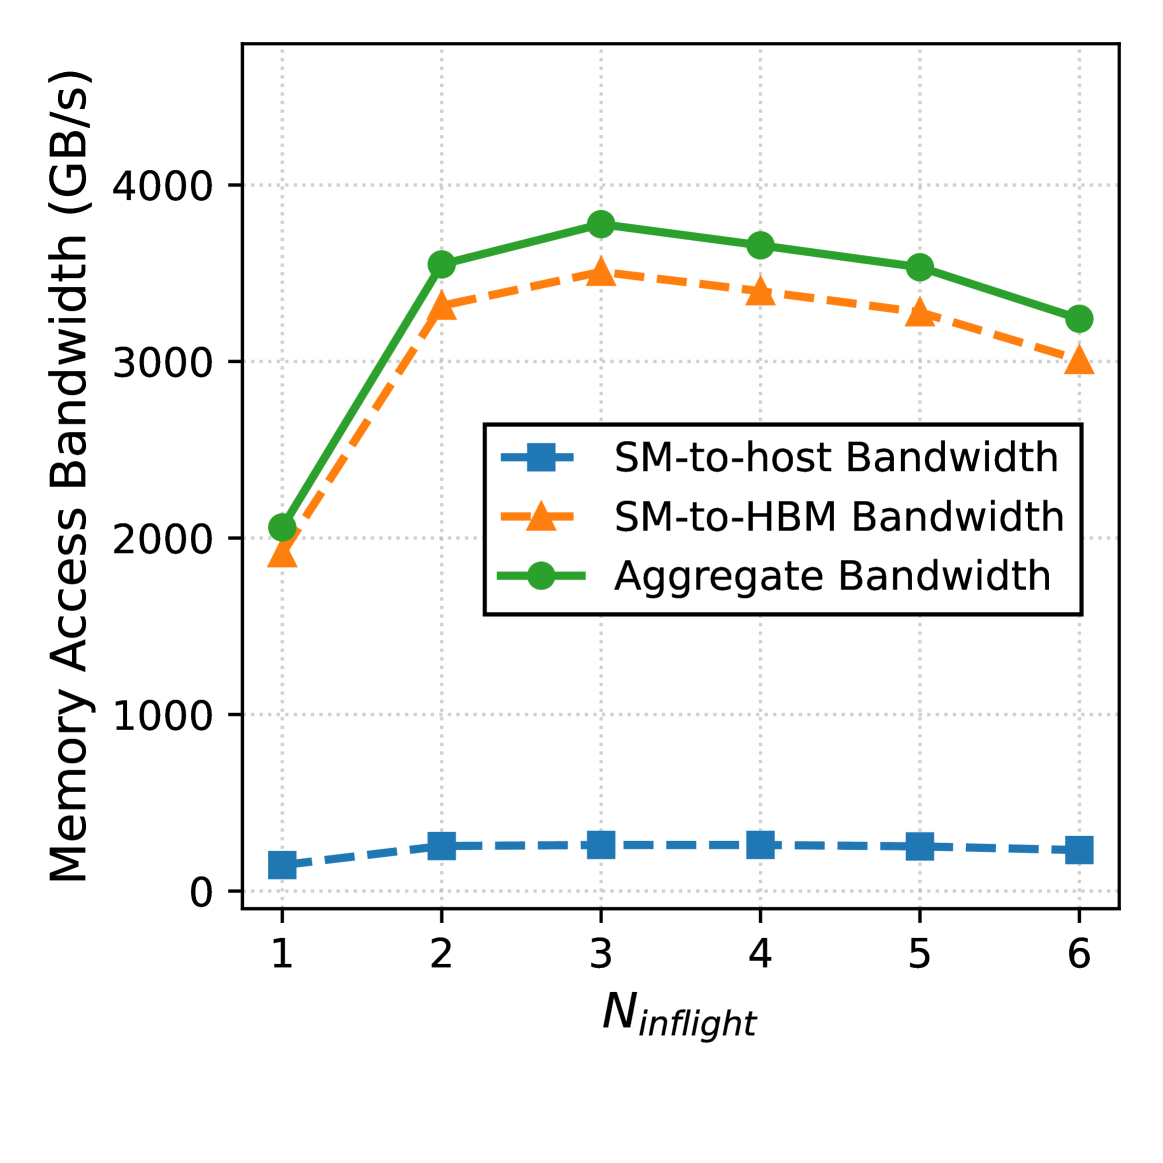
The graph illustrates the relationship between memory access bandwidth (GB/s) and the number of inflight operations (N_inflight) across three data series: SM-to-host Bandwidth, SM-to-HBM Bandwidth, and Aggregate Bandwidth. The y-axis represents bandwidth in GB/s, while the x-axis ranges from N_inflight = 1 to 6.
### Components/Axes
- **X-axis (N_inflight)**: Integer values from 1 to 6, labeled "N_inflight".
- **Y-axis (Memory Access Bandwidth)**: Scale from 0 to 4000 GB/s, labeled "Memory Access Bandwidth (GB/s)".
- **Legend**: Located in the top-right corner, with three entries:
- **Blue squares**: SM-to-host Bandwidth
- **Orange triangles**: SM-to-HBM Bandwidth
- **Green circles**: Aggregate Bandwidth
### Detailed Analysis
1. **SM-to-host Bandwidth (Blue Squares)**:
- **Trend**: Flat line at approximately 200 GB/s across all N_inflight values (1–6).
- **Data Points**: Consistent at ~200 GB/s, with no variation.
2. **SM-to-HBM Bandwidth (Orange Triangles)**:
- **Trend**: Increases sharply from N_inflight = 1 to 3, peaks at N_inflight = 3 (~3500 GB/s), then declines to ~3000 GB/s at N_inflight = 6.
- **Data Points**:
- N_inflight = 1: ~1900 GB/s
- N_inflight = 2: ~3300 GB/s
- N_inflight = 3: ~3500 GB/s
- N_inflight = 4: ~3400 GB/s
- N_inflight = 5: ~3250 GB/s
- N_inflight = 6: ~3000 GB/s
3. **Aggregate Bandwidth (Green Circles)**:
- **Trend**: Mirrors SM-to-HBM but with higher values. Peaks at N_inflight = 3 (~3800 GB/s), then declines to ~3200 GB/s at N_inflight = 6.
- **Data Points**:
- N_inflight = 1: ~2000 GB/s
- N_inflight = 2: ~3500 GB/s
- N_inflight = 3: ~3800 GB/s
- N_inflight = 4: ~3600 GB/s
- N_inflight = 5: ~3450 GB/s
- N_inflight = 6: ~3200 GB/s
### Key Observations
- **SM-to-host Bandwidth** remains constant regardless of N_inflight.
- **SM-to-HBM Bandwidth** and **Aggregate Bandwidth** exhibit a peak at N_inflight = 3, followed by a decline.
- **Aggregate Bandwidth** consistently exceeds SM-to-HBM Bandwidth by ~200–500 GB/s across all N_inflight values.
- The sharpest increase in bandwidth occurs between N_inflight = 1 and 2 for both SM-to-HBM and Aggregate.
### Interpretation
The data suggests that memory access bandwidth is highly sensitive to N_inflight up to a critical point (N_inflight = 3), after which performance degrades. The Aggregate Bandwidth likely represents a combined or optimized utilization of SM-to-HBM and SM-to-host resources, as it consistently outperforms SM-to-HBM alone. The flat SM-to-host Bandwidth indicates it is decoupled from N_inflight, possibly due to fixed hardware constraints. The peak at N_inflight = 3 may reflect optimal parallelism or resource allocation, while the subsequent decline could signal contention or saturation in memory access pathways.