## Heatmap: Layer vs. Token Activation/Attention Pattern
### Overview
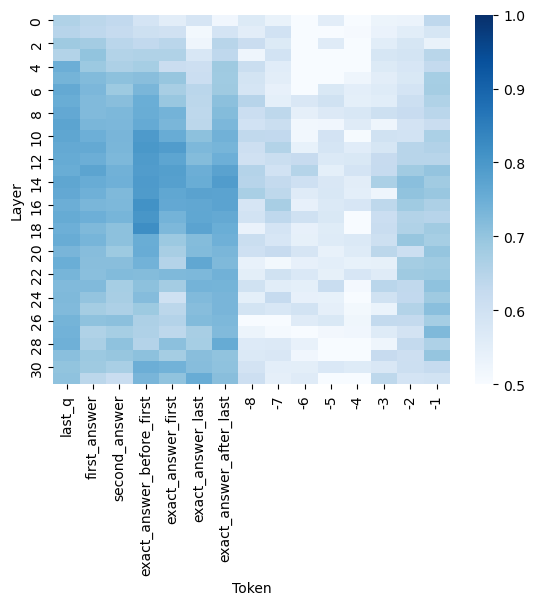
The image is a heatmap visualization, likely representing activation strengths, attention weights, or some form of normalized score (ranging from 0.5 to 1.0) across different layers of a neural network model and specific token positions. The chart shows how a particular metric varies for different tokens at each layer depth.
### Components/Axes
* **Chart Type:** Heatmap.
* **Y-Axis (Vertical):** Labeled **"Layer"**. It represents the depth within a model, with tick marks and labels at intervals of 2, starting from **0** at the top and descending to **30** at the bottom.
* **X-Axis (Horizontal):** Labeled **"Token"**. It lists specific token identifiers or positions. The labels are rotated 90 degrees for readability. From left to right, the tokens are:
1. `last_q`
2. `first_answer`
3. `second_answer`
4. `exact_answer_before_first`
5. `exact_answer_first`
6. `exact_answer_last`
7. `exact_answer_after_last`
8. `-8`
9. `-7`
10. `-6`
11. `-5`
12. `-4`
13. `-3`
14. `-2`
15. `-1`
* **Color Bar/Legend:** Positioned on the **right side** of the chart. It is a vertical gradient bar mapping color intensity to numerical values.
* **Scale:** Linear, from **0.5** (lightest blue/white) at the bottom to **1.0** (darkest blue) at the top.
* **Labels:** Major ticks are labeled at **0.5, 0.6, 0.7, 0.8, 0.9, and 1.0**.
### Detailed Analysis
The heatmap displays a grid where each cell's color corresponds to a value between 0.5 and 1.0 for a specific Layer-Token pair.
**General Trend Verification:**
* **Vertical Trend (Per Token):** For most tokens, the value (color intensity) is not constant across layers. There is significant variation from top (Layer 0) to bottom (Layer 30).
* **Horizontal Trend (Per Layer):** Within a single layer row, the value varies considerably across different tokens. No single layer shows a uniform color across all tokens.
**Specific Observations by Token Group:**
1. **Named Tokens (Left 7 columns):**
* `last_q`, `first_answer`, `second_answer`: Show moderate to high values (medium to dark blue) in the early-to-mid layers (approx. Layers 0-16). The intensity often peaks around Layers 4-12.
* `exact_answer_before_first`, `exact_answer_first`, `exact_answer_last`: These three tokens exhibit a very strong, consistent pattern. They display the **highest values (darkest blue, ~0.9-1.0)** across a broad range of layers, particularly from Layer 4 down to approximately Layer 20. This forms a prominent dark vertical band in the center-left of the heatmap.
* `exact_answer_after_last`: Shows a more moderate pattern, with higher values in early layers that fade in deeper layers.
2. **Numerical Tokens (Right 8 columns, `-8` to `-1`):**
* These tokens generally show **lower values (lighter blue, ~0.5-0.7)** compared to the named "exact_answer" tokens.
* There is a subtle gradient: tokens `-8` and `-7` tend to have slightly higher values in the very early layers (0-6) compared to tokens `-1` and `-2`.
* The region for these tokens becomes very light (values near 0.5) in the middle layers (approx. Layers 10-22), indicating minimal activation or attention.
**Spatial Grounding & Key Data Points:**
* **Highest Values (~1.0):** Concentrated in the columns for `exact_answer_before_first`, `exact_answer_first`, and `exact_answer_last`, primarily between **Layers 8 and 16**.
* **Lowest Values (~0.5):** Found in the columns for the numerical tokens (`-5` to `-1`) in the **middle layer range (Layers 12-20)**.
* **Notable Anomaly:** The column for `exact_answer_after_last` shows a pocket of higher value (darker blue) around **Layer 26-28**, which is an outlier compared to its surrounding layers and the general trend of the numerical tokens to its right.
### Key Observations
1. **Strong Selective Activation:** The model's internal representations (as measured by this metric) are highly selective. Tokens related to the "exact answer" (especially `before_first`, `first`, and `last`) elicit a much stronger response across many layers than the question token (`last_q`) or other answer tokens.
2. **Layer-Specific Processing:** The processing focus shifts with depth. Early layers (0-10) show broad activation across many named tokens. Mid-layers (10-20) show extreme specialization for the core "exact answer" tokens. Deeper layers (20-30) show a more diffuse and generally weaker pattern.
3. **Positional Encoding for Numerical Tokens:** The numerical tokens (`-8` to `-1`), which likely represent relative positions (e.g., tokens before the answer), show a weak and fading signal, suggesting they are less critical for the measured metric in deeper processing stages.
### Interpretation
This heatmap likely visualizes **attention weights** or **activation norms** from a transformer-based model during a question-answering task. The data suggests the model has learned to strongly focus on and process the tokens that constitute the "exact answer" throughout a significant portion of its network depth (Layers 4-20). This indicates these tokens are information-rich and central to the model's reasoning or output generation process.
The weaker signal for the question token (`last_q`) and other answer tokens implies they may serve more as context, while the core answer tokens are the primary carriers of the required information. The fading signal for positional numerical tokens in mid-layers suggests that precise positional information becomes less important as the model integrates semantic meaning in deeper layers. The outlier high-value spot for `exact_answer_after_last` in deep layers could indicate a late-stage verification or formatting step related to the answer's boundary.
In essence, the chart provides a "brain scan" of the model, revealing which parts of the input it deems most important and at what stage of processing. The clear, strong pattern for the exact answer tokens is a sign of a model that has successfully learned to identify and prioritize the key information for its task.