\n
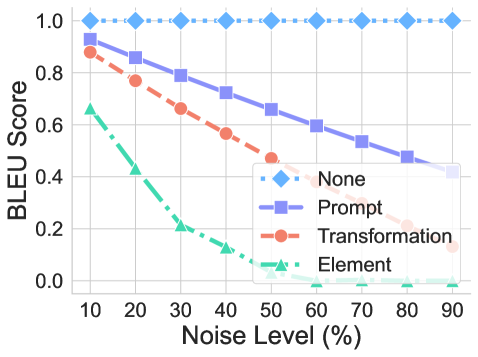
## Line Chart: BLEU Score vs. Noise Level
### Overview
This line chart depicts the relationship between Noise Level (as a percentage) and BLEU Score for four different conditions: None, Prompt, Transformation, and Element. The chart illustrates how each condition's BLEU score degrades as the noise level increases.
### Components/Axes
* **X-axis:** Noise Level (%), ranging from 10% to 90% with increments of 10%.
* **Y-axis:** BLEU Score, ranging from 0.0 to 1.0 with increments of 0.2.
* **Legend:** Located in the center-right of the chart, identifying the four data series:
* None (Light Blue Diamonds)
* Prompt (Blue Squares)
* Transformation (Orange Circles)
* Element (Green Triangles)
* **Gridlines:** Present to aid in reading values.
### Detailed Analysis
Here's a breakdown of each data series, noting trends and approximate values:
* **None (Light Blue Diamonds):** This line is nearly flat, indicating that the BLEU score remains consistently high (approximately 1.0) regardless of the noise level.
* 10%: ~1.02
* 20%: ~1.02
* 30%: ~1.02
* 40%: ~1.02
* 50%: ~1.02
* 60%: ~1.02
* 70%: ~1.02
* 80%: ~1.02
* 90%: ~1.02
* **Prompt (Blue Squares):** This line slopes downward, indicating a decrease in BLEU score as noise level increases. The decline is more pronounced at higher noise levels.
* 10%: ~0.98
* 20%: ~0.94
* 30%: ~0.88
* 40%: ~0.82
* 50%: ~0.76
* 60%: ~0.68
* 70%: ~0.60
* 80%: ~0.52
* 90%: ~0.44
* **Transformation (Orange Circles):** This line also slopes downward, but the decrease in BLEU score is more rapid than the "Prompt" line.
* 10%: ~0.88
* 20%: ~0.82
* 30%: ~0.76
* 40%: ~0.70
* 50%: ~0.64
* 60%: ~0.58
* 70%: ~0.52
* 80%: ~0.46
* 90%: ~0.40
* **Element (Green Triangles):** This line exhibits the steepest downward slope, indicating the most significant degradation in BLEU score with increasing noise level.
* 10%: ~0.64
* 20%: ~0.48
* 30%: ~0.24
* 40%: ~0.08
* 50%: ~0.00
* 60%: ~0.00
* 70%: ~0.00
* 80%: ~0.00
* 90%: ~0.00
### Key Observations
* The "None" condition maintains a consistently high BLEU score, unaffected by noise.
* The "Element" condition is the most sensitive to noise, experiencing a rapid and complete loss of BLEU score as noise level increases.
* The "Prompt" and "Transformation" conditions fall between "None" and "Element" in terms of noise sensitivity.
* The BLEU score for "Element" drops to zero at 50% noise level.
### Interpretation
The chart demonstrates the robustness of different approaches to noise in a system. The "None" condition suggests a system that is inherently resilient to noise. The "Prompt", "Transformation", and "Element" conditions represent methods that are increasingly vulnerable to noise. The "Element" method is particularly susceptible, indicating a potential weakness in its design or implementation.
The rapid decline in BLEU score for the "Element" condition suggests that even moderate levels of noise can render it ineffective. This could be due to the method relying on subtle features that are easily disrupted by noise, or a lack of error correction mechanisms. The chart highlights the importance of considering noise robustness when selecting or designing methods for noisy environments. The data suggests that the "None" approach is the most reliable in the presence of noise, while the "Element" approach should be avoided or significantly improved.