## Line Chart: Accuracy vs. Maximum Depth for PoG and PoG-E Methods
### Overview
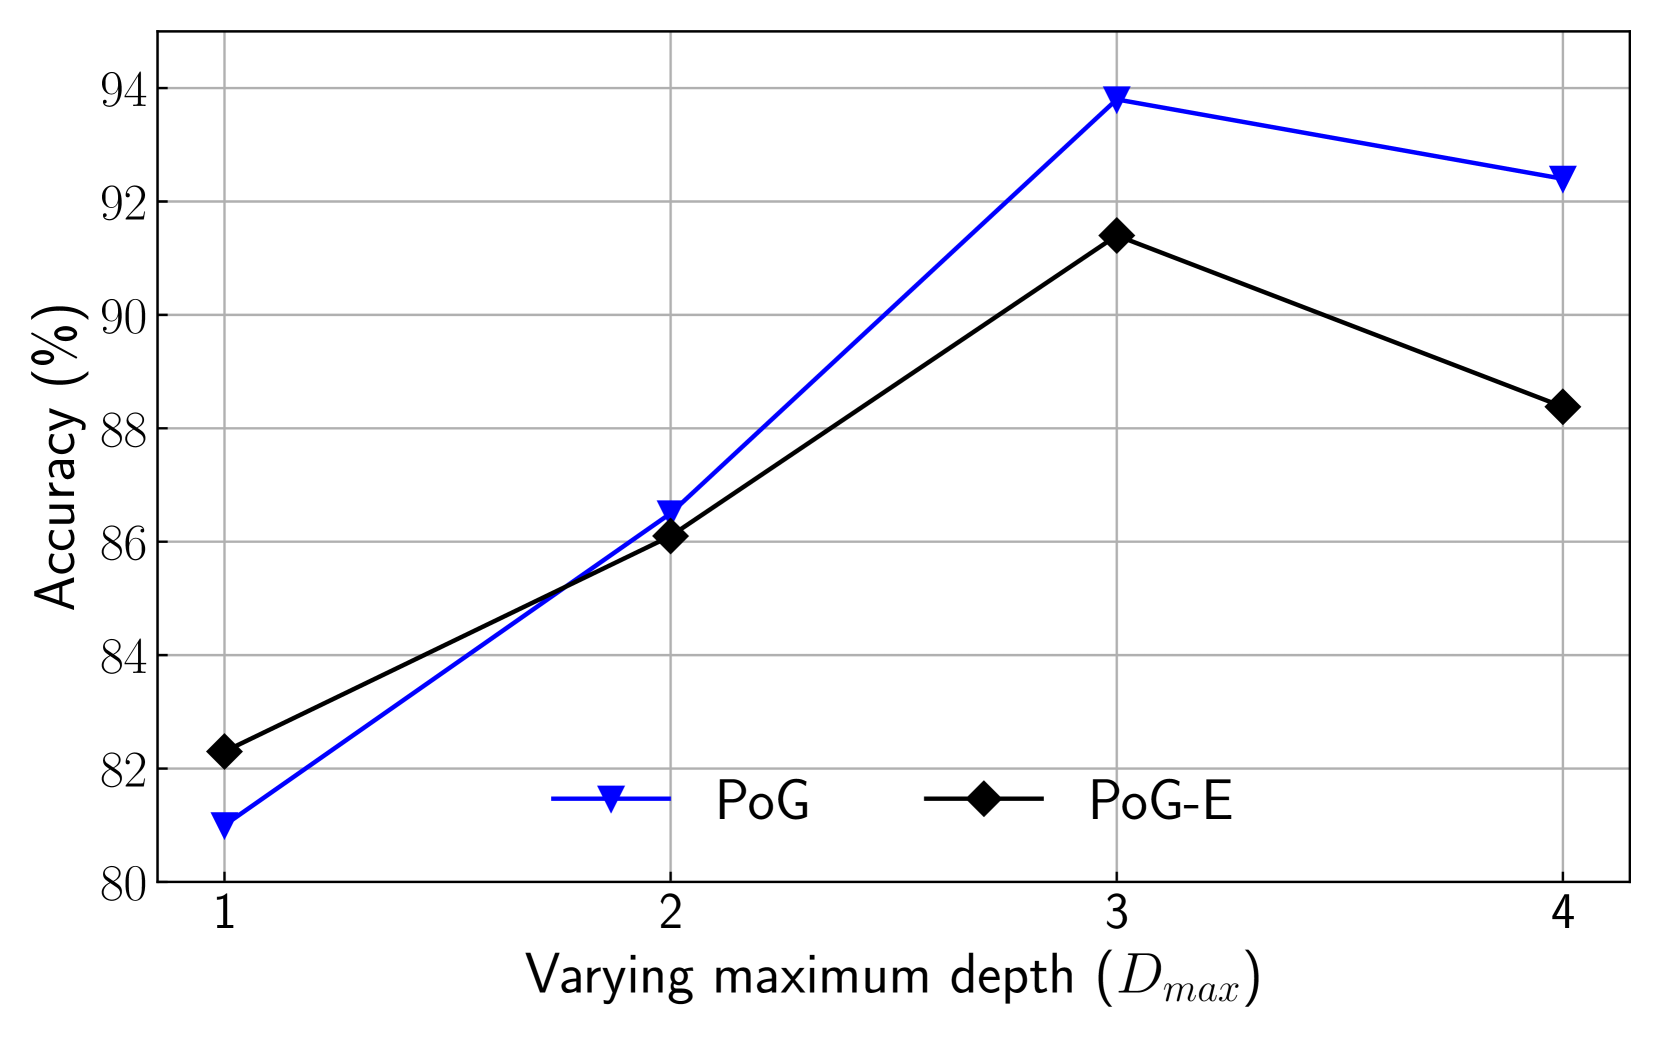
The image is a line chart comparing the performance (accuracy) of two methods, labeled "PoG" and "PoG-E," as a function of a parameter called "Varying maximum depth (D_max)." The chart shows that both methods improve in accuracy as depth increases from 1 to 3, but then experience a decline at depth 4. The "PoG" method consistently achieves higher accuracy than "PoG-E" at depths 2, 3, and 4.
### Components/Axes
* **Chart Type:** Line chart with markers.
* **X-Axis:**
* **Label:** "Varying maximum depth (D_max)"
* **Scale:** Discrete integer values: 1, 2, 3, 4.
* **Y-Axis:**
* **Label:** "Accuracy (%)"
* **Scale:** Linear scale from 80 to 94, with major gridlines at intervals of 2 (80, 82, 84, 86, 88, 90, 92, 94).
* **Legend:**
* **Position:** Bottom center of the chart area.
* **Series 1:** "PoG" - Represented by a blue line with downward-pointing triangle markers (▼).
* **Series 2:** "PoG-E" - Represented by a black line with diamond markers (◆).
* **Grid:** A light gray grid is present for both major x and y ticks.
### Detailed Analysis
**Data Series: PoG (Blue line, ▼ markers)**
* **Trend:** The line slopes steeply upward from depth 1 to 3, then slopes slightly downward to depth 4.
* **Data Points (Approximate):**
* D_max = 1: Accuracy ≈ 81.0%
* D_max = 2: Accuracy ≈ 86.5%
* D_max = 3: Accuracy ≈ 93.8% (Peak)
* D_max = 4: Accuracy ≈ 92.4%
**Data Series: PoG-E (Black line, ◆ markers)**
* **Trend:** The line slopes upward from depth 1 to 3, then slopes downward to depth 4. The slope is less steep than the PoG line between depths 1 and 3.
* **Data Points (Approximate):**
* D_max = 1: Accuracy ≈ 82.3%
* D_max = 2: Accuracy ≈ 86.1%
* D_max = 3: Accuracy ≈ 91.4% (Peak)
* D_max = 4: Accuracy ≈ 88.4%
### Key Observations
1. **Performance Peak:** Both methods achieve their highest accuracy at a maximum depth (D_max) of 3.
2. **Relative Performance:** PoG-E starts with a slightly higher accuracy than PoG at D_max=1 (≈82.3% vs. ≈81.0%). However, PoG surpasses PoG-E at D_max=2 and maintains a significant lead at D_max=3 and D_max=4.
3. **Performance Drop-off:** Both methods show a decrease in accuracy when moving from D_max=3 to D_max=4. The drop is more pronounced for PoG-E (≈3.0 percentage points) than for PoG (≈1.4 percentage points).
4. **Greatest Divergence:** The largest performance gap between the two methods occurs at D_max=3, where PoG outperforms PoG-E by approximately 2.4 percentage points.
### Interpretation
The chart demonstrates the relationship between model complexity (controlled by maximum depth, D_max) and predictive accuracy for two related algorithms, PoG and PoG-E. The data suggests an optimal complexity point at D_max=3 for both methods, where accuracy is maximized. Increasing depth beyond this point (to 4) leads to a decline in performance, which could indicate the onset of overfitting, where the model becomes too specialized to the training data and loses generalization ability.
The "PoG" variant appears to be the more robust and effective method overall, as it not only achieves a higher peak accuracy but also experiences a less severe performance degradation at the highest tested depth. The initial advantage of PoG-E at the simplest configuration (D_max=1) is quickly overcome, suggesting that PoG scales better with increased model complexity within the tested range. This analysis would be crucial for a practitioner deciding which method to use and what depth parameter to select for their specific application, balancing accuracy against potential computational costs associated with greater depth.