TECHNICAL ASSET FINGERPRINT
6c9177b1cd98d2e54d0ddf50
Click to view fullscreen
Press ESC or click to close
FOUND IN PAPERS
EXPERT: healer-alpha-free VERSION 1
RUNTIME: free/openrouter/healer-alpha
INTEL_VERIFIED
\n
## Line Chart: Brain Alignment vs. Pythia Model Size for Multiple Datasets
### Overview
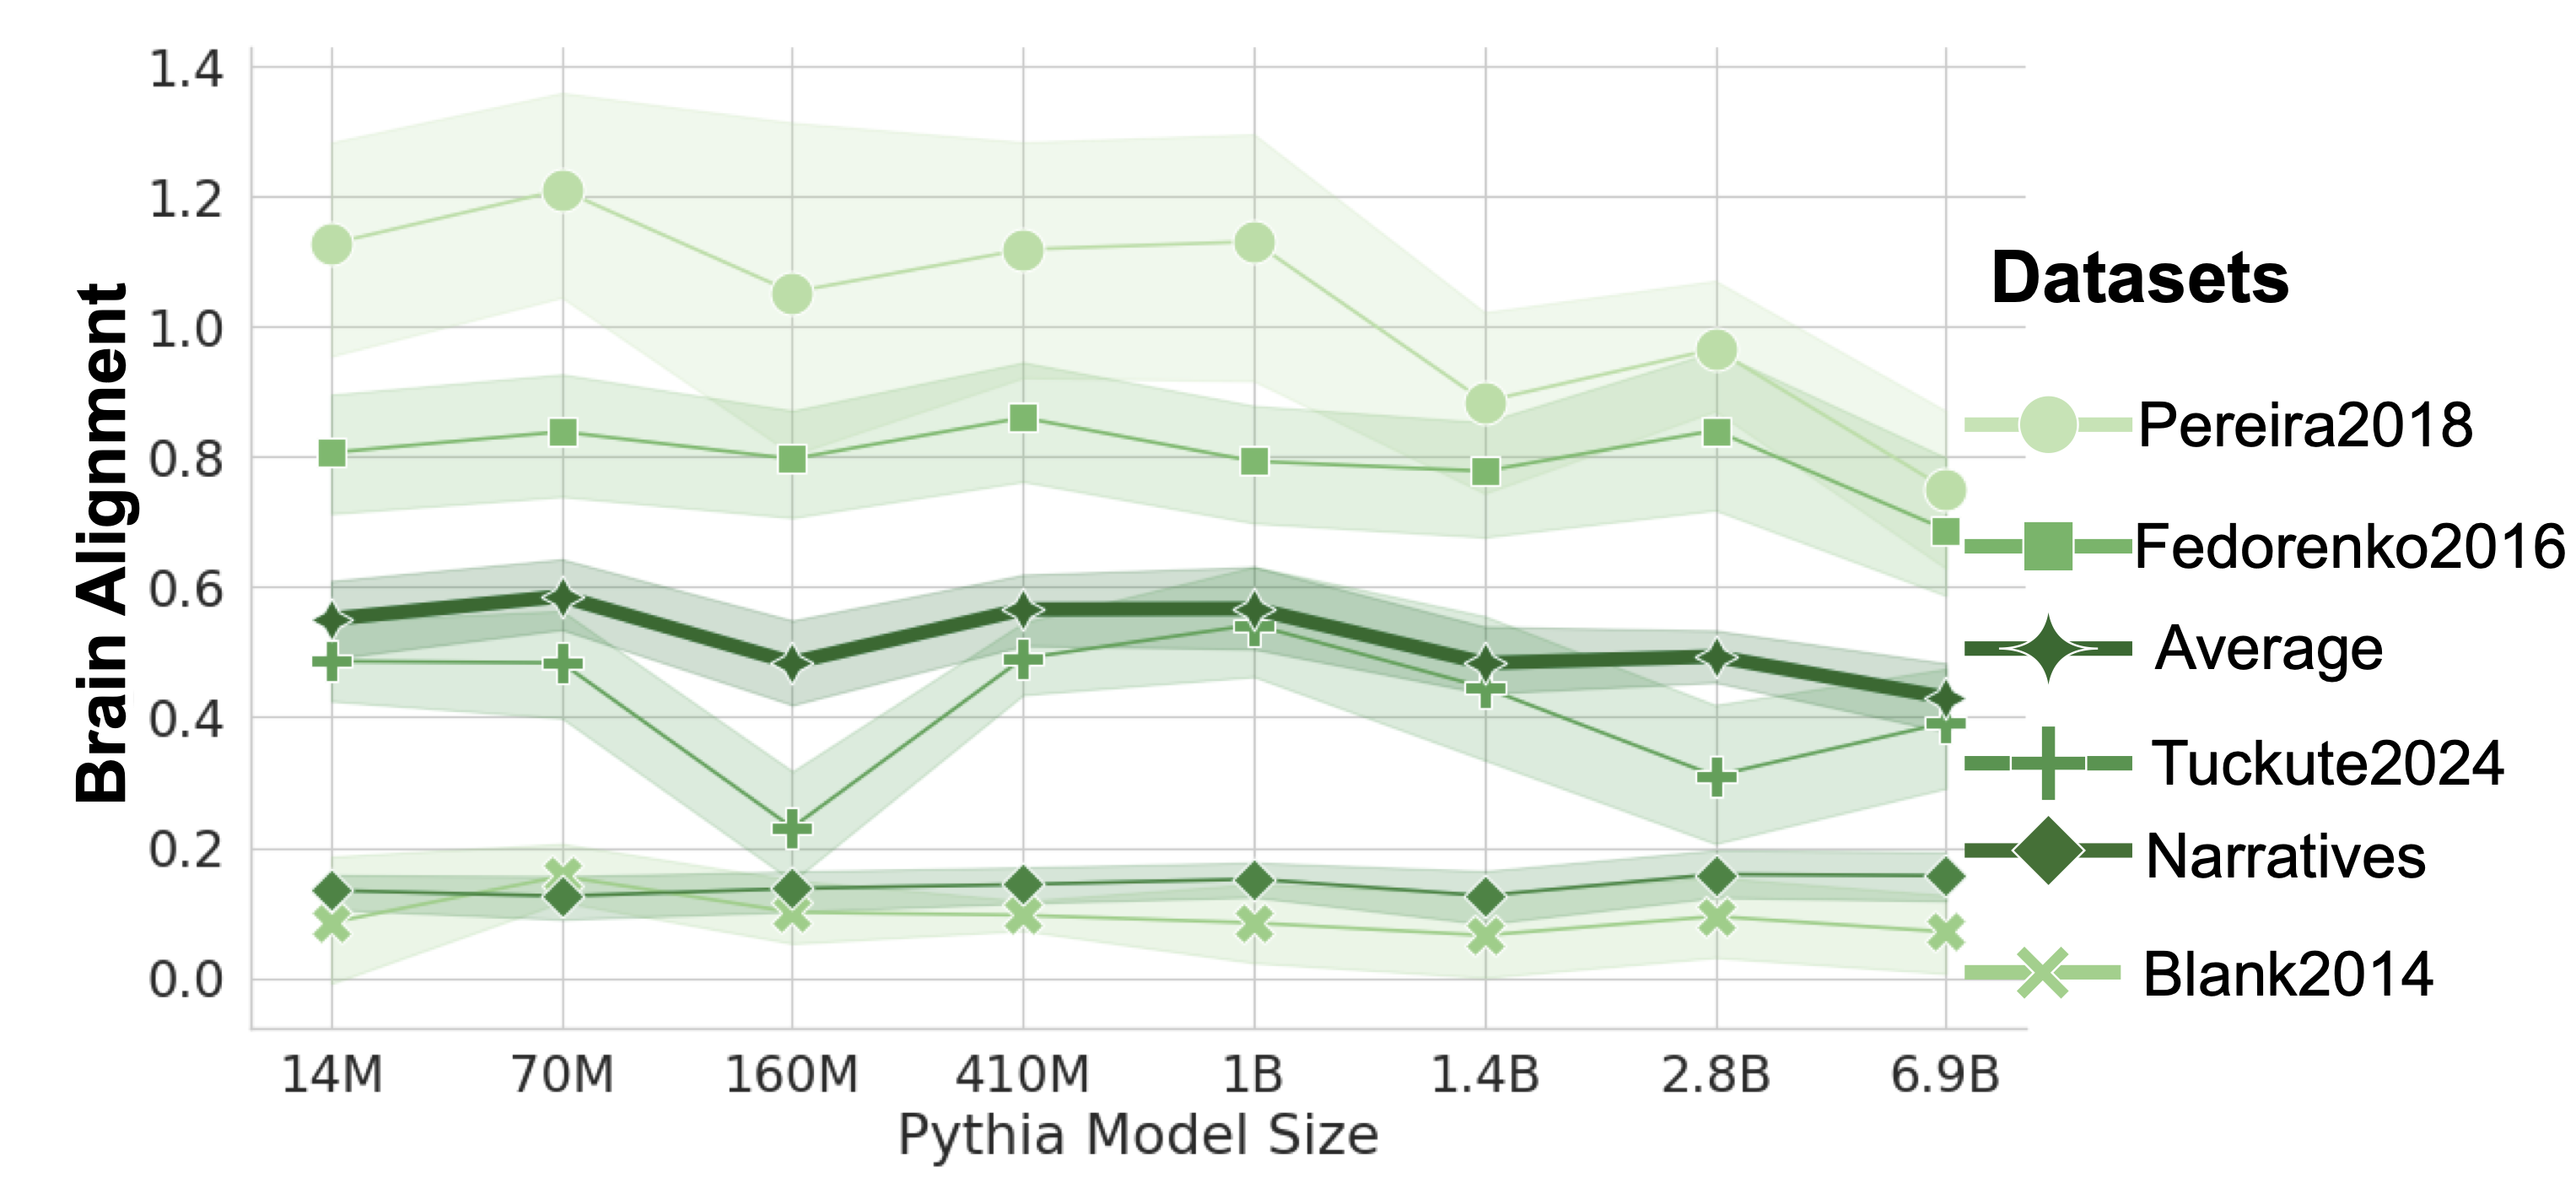
The image is a line chart displaying "Brain Alignment" scores on the y-axis against increasing "Pythia Model Size" on the x-axis. It compares the performance of six different datasets, each represented by a distinct line with markers and a shaded confidence interval band. The chart suggests an analysis of how well language models of varying sizes align with neural brain data from different sources.
### Components/Axes
* **Y-Axis (Vertical):** Labeled **"Brain Alignment"**. The scale ranges from 0.0 to 1.4, with major gridlines at intervals of 0.2.
* **X-Axis (Horizontal):** Labeled **"Pythia Model Size"**. It is a categorical axis with the following discrete model sizes listed from left to right: **14M, 70M, 160M, 410M, 1B, 1.4B, 2.8B, 6.9B**.
* **Legend:** Positioned on the right side of the chart, titled **"Datasets"**. It lists six datasets with corresponding line colors, marker shapes, and labels:
1. **Pereira2018** - Light green line with circle markers (●).
2. **Fedorenko2016** - Medium green line with square markers (■).
3. **Average** - Dark green, thick line with diamond markers (◆).
4. **Tuckute2024** - Medium green line with plus markers (+).
5. **Narratives** - Dark green line with diamond markers (◆). *Note: Shares the same marker shape as "Average" but is a separate, thinner line.*
6. **Blank2014** - Light green line with cross markers (✕).
### Detailed Analysis
Data points are approximate values read from the chart. Each series is described with its visual trend before listing points.
**1. Pereira2018 (Light Green, Circles ●)**
* **Trend:** Starts high, peaks at 70M, then shows a general downward trend with some fluctuation, ending lower than it started.
* **Approximate Data Points:**
* 14M: ~1.13
* 70M: ~1.21 (Peak)
* 160M: ~1.06
* 410M: ~1.12
* 1B: ~1.14
* 1.4B: ~0.89
* 2.8B: ~0.97
* 6.9B: ~0.76
**2. Fedorenko2016 (Medium Green, Squares ■)**
* **Trend:** Relatively stable with minor fluctuations between ~0.8 and ~0.85 for most sizes, with a slight dip at 1.4B and a final drop at 6.9B.
* **Approximate Data Points:**
* 14M: ~0.81
* 70M: ~0.84
* 160M: ~0.80
* 410M: ~0.86
* 1B: ~0.80
* 1.4B: ~0.78
* 2.8B: ~0.84
* 6.9B: ~0.69
**3. Average (Dark Green, Thick Line, Diamonds ◆)**
* **Trend:** Shows a slight peak at 70M, a dip at 160M, recovers, and then gradually declines from 1B onward.
* **Approximate Data Points:**
* 14M: ~0.55
* 70M: ~0.58
* 160M: ~0.49
* 410M: ~0.57
* 1B: ~0.57
* 1.4B: ~0.49
* 2.8B: ~0.50
* 6.9B: ~0.43
**4. Tuckute2024 (Medium Green, Plus +)**
* **Trend:** Exhibits a significant dip at 160M, recovers to a peak at 1B, then declines sharply before a slight rise at the largest size.
* **Approximate Data Points:**
* 14M: ~0.49
* 70M: ~0.48
* 160M: ~0.23 (Significant dip)
* 410M: ~0.49
* 1B: ~0.54 (Peak)
* 1.4B: ~0.45
* 2.8B: ~0.31
* 6.9B: ~0.39
**5. Narratives (Dark Green, Thin Line, Diamonds ◆)**
* **Trend:** Very flat and stable across all model sizes, consistently scoring low.
* **Approximate Data Points:**
* All model sizes (14M to 6.9B): ~0.13 to ~0.16 (hovering around 0.15).
**6. Blank2014 (Light Green, Crosses ✕)**
* **Trend:** The lowest and flattest line, showing minimal change across model sizes.
* **Approximate Data Points:**
* All model sizes (14M to 6.9B): ~0.08 to ~0.12 (hovering around 0.10).
### Key Observations
1. **Hierarchy of Scores:** There is a clear and consistent hierarchy in alignment scores across datasets. Pereira2018 > Fedorenko2016 > Average ≈ Tuckute2024 > Narratives > Blank2014. This order is maintained across nearly all model sizes.
2. **Non-Monotonic Scaling:** Brain alignment does not consistently increase with model size for any dataset. Most lines show peaks at intermediate sizes (e.g., 70M, 1B) and declines at the largest size (6.9B).
3. **Dataset-Specific Anomalies:** The Tuckute2024 dataset shows a pronounced, isolated dip at the 160M model size, which is not mirrored in the other datasets to the same degree.
4. **Convergence at Large Scale:** At the largest model size (6.9B), the scores for the top three datasets (Pereira2018, Fedorenko2016, Average) converge closer together compared to their spread at smaller sizes.
5. **Low Baselines:** The Narratives and Blank2014 datasets serve as low baselines, showing almost no sensitivity to model scale in this metric.
### Interpretation
This chart presents a nuanced view of how language model scale relates to "brain alignment," a metric likely quantifying the similarity between model representations and human brain activity patterns.
* **The "Bigger is Better" Assumption is Challenged:** The data suggests that increasing the parameter count of Pythia models does not guarantee improved alignment with neural data. In fact, for several datasets, alignment peaks at intermediate sizes (70M to 1B parameters) and degrades for the largest model (6.9B). This could indicate overfitting, a shift in representational strategy, or that the alignment metric is sensitive to specific model characteristics not purely tied to size.
* **Dataset Dependency is Critical:** The vast difference in absolute scores and scaling trends between datasets (e.g., Pereira2018 vs. Blank2014) highlights that "brain alignment" is not a monolithic property. It depends heavily on the specific neural dataset, task, or brain region used for comparison. The high-performing datasets (Pereira2018, Fedorenko2016) may involve paradigms (e.g., language comprehension) that the Pythia models capture better at certain scales.
* **The "Average" Line as a Summary:** The "Average" line, which sits in the middle of the pack, smooths out dataset-specific quirks like the Tuckute2024 dip. Its gentle rise and fall suggest a broad, weak trend where moderate-scale models might be most "brain-like" on average across these specific benchmarks.
* **Implications for Model Development:** If the goal is to develop models that process information in a brain-like manner, this data argues for careful scaling and evaluation. Simply scaling up may not be optimal; instead, architectural choices or training objectives that foster alignment at specific scales might be more important. The results also caution against generalizing findings from one neural dataset to others.
DECODING INTELLIGENCE...