## Line Chart: Speedup Comparison of Work Stealing vs. Non Work Stealing in MPI
### Overview
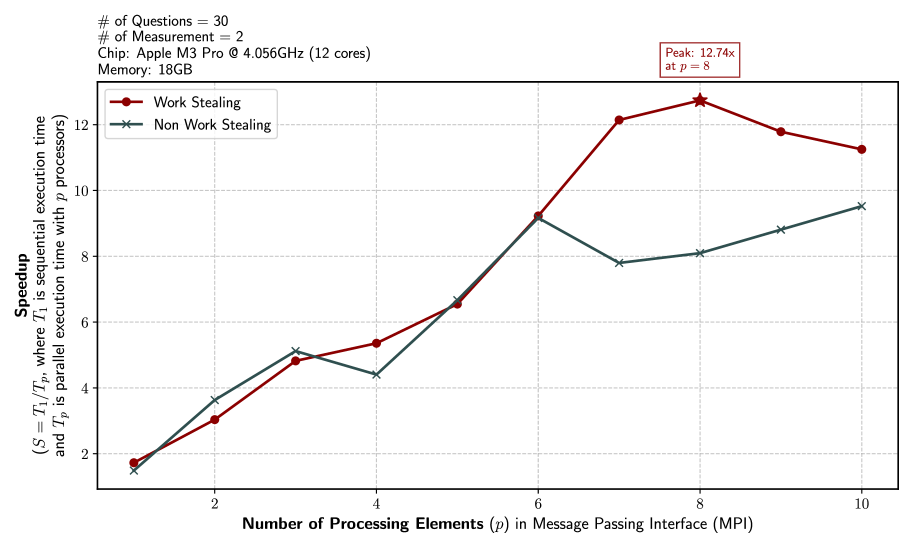
This is a line chart comparing the parallel speedup performance of two execution strategies—"Work Stealing" and "Non Work Stealing"—as the number of processing elements increases. The chart is generated from a specific computational experiment. Metadata about the experiment is provided in the top-left corner.
### Components/Axes
* **Chart Type:** Line chart with markers.
* **X-Axis:** Labeled **"Number of Processing Elements (p) in Message Passing Interface (MPI)"**. The axis has major tick marks and labels at p = 2, 4, 6, 8, and 10. The data points are plotted at integer values from p=1 to p=10.
* **Y-Axis:** Labeled **"Speedup"** with a parenthetical definition: **"(S = T₁ / Tₚ, where T₁ is sequential execution time and Tₚ is parallel execution time with p processors)"**. The axis has major tick marks and labels at intervals of 2, from 2 to 12.
* **Legend:** Located in the top-left quadrant of the plot area.
* **Red line with circle markers:** Labeled **"Work Stealing"**.
* **Teal (dark cyan) line with 'x' markers:** Labeled **"Non Work Stealing"**.
* **Annotation:** A red-bordered text box in the top-right quadrant states: **"Peak: 12.74x at p = 8"**. This annotation points to the highest data point on the "Work Stealing" line.
* **Metadata (Top-Left Corner):**
* `# of Questions = 30`
* `# of Measurement = 2`
* `Chip: Apple M3 Pro @ 4.056GHz (12 cores)`
* `Memory: 18GB`
* **Grid:** A light gray grid is present for both major x and y ticks.
### Detailed Analysis
**Trend Verification & Data Point Extraction:**
1. **Work Stealing (Red Line, Circle Markers):**
* **Trend:** The line shows a generally strong upward trend, peaking at p=8 before declining slightly. It consistently outperforms the Non Work Stealing method for p ≥ 6.
* **Data Points (Approximate Speedup):**
* p=1: ~1.8
* p=2: ~3.0
* p=3: ~4.8
* p=4: ~5.3
* p=5: ~6.5
* p=6: ~9.2
* p=7: ~12.1
* p=8: **12.74** (explicitly annotated as the peak)
* p=9: ~11.8
* p=10: ~11.2
2. **Non Work Stealing (Teal Line, 'x' Markers):**
* **Trend:** The line shows an upward trend with notable volatility. It initially leads at p=3, dips at p=4, recovers, then dips again at p=7 before a final rise. Its growth is less consistent than the Work Stealing method.
* **Data Points (Approximate Speedup):**
* p=1: ~1.5
* p=2: ~3.6
* p=3: ~5.1
* p=4: ~4.4
* p=5: ~6.6
* p=6: ~9.2 (approximately equal to Work Stealing at this point)
* p=7: ~7.8
* p=8: ~8.1
* p=9: ~8.8
* p=10: ~9.5
### Key Observations
1. **Crossover Point:** The two methods perform nearly identically at p=6 (both ~9.2x speedup). This is the last point where they are comparable.
2. **Divergence:** After p=6, the Work Stealing method shows a dramatic performance increase, while the Non Work Stealing method experiences a significant drop at p=7.
3. **Peak Performance:** The absolute peak speedup for the entire chart is **12.74x**, achieved by the Work Stealing method with 8 processors.
4. **Sub-linear Scaling:** Neither method achieves perfect linear speedup (e.g., 10x speedup with 10 processors). The Work Stealing method comes closest, exceeding 10x speedup from p=7 to p=10.
5. **Volatility:** The Non Work Stealing performance is more erratic, with two clear dips (at p=4 and p=7), suggesting potential load imbalance or synchronization overhead issues at those specific processor counts.
### Interpretation
The data demonstrates the significant performance advantage of employing a **Work Stealing** scheduling strategy over a **Non Work Stealing** (likely static or naive) approach for this specific parallel workload (30 questions, measured twice) on the given 12-core Apple M3 Pro system.
* **Scalability:** Work Stealing enables much better scalability, effectively utilizing up to 8 cores before diminishing returns set in. The Non Work Stealing method struggles to scale effectively beyond 6 cores, indicating it may be hitting a bottleneck related to task distribution or communication.
* **The "Why" Behind the Trends:** The dip for Non Work Stealing at p=4 and especially at p=7 could indicate points where the static task partitioning leads to significant load imbalance—some processors finish early and idle while others are still busy. Work Stealing mitigates this by allowing idle processors to "steal" tasks from busy ones, leading to smoother utilization and the strong upward trend seen after p=6.
* **Practical Implication:** For this class of problem on this hardware, implementing a work stealing scheduler is highly beneficial. The peak at p=8 (not p=12, the core count) suggests the optimal parallelism is less than the total core count, possibly due to memory bandwidth constraints, the nature of the tasks, or the overhead of managing 12 concurrent threads. The annotation highlighting the 12.74x peak underscores this as the key result of the experiment.