## Line Chart: MSE vs. Pilot Size for Different Estimation Methods
### Overview
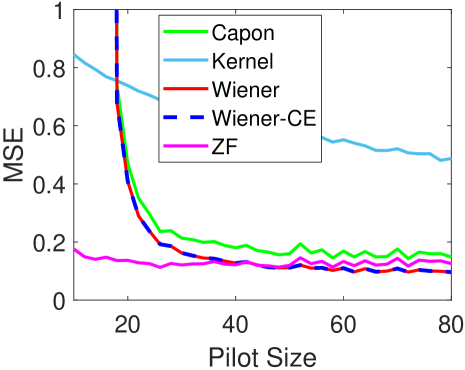
The image is a line chart comparing the Mean Squared Error (MSE) of different estimation methods (Capon, Kernel, Wiener, Wiener-CE, and ZF) as a function of Pilot Size. The x-axis represents the Pilot Size, ranging from approximately 0 to 80. The y-axis represents the MSE, ranging from 0 to 1. The chart displays how the MSE changes with increasing Pilot Size for each method.
### Components/Axes
* **X-axis:** Pilot Size, ranging from 0 to 80, with tick marks at 20, 40, 60, and 80.
* **Y-axis:** MSE (Mean Squared Error), ranging from 0 to 1, with tick marks at 0, 0.2, 0.4, 0.6, 0.8, and 1.
* **Legend:** Located in the top-left corner, identifying each line by color and method:
* Green: Capon
* Light Blue: Kernel
* Red: Wiener
* Dashed Dark Blue: Wiener-CE
* Magenta: ZF
### Detailed Analysis
* **Capon (Green):** The green line representing the Capon method starts at approximately MSE 0.8 at Pilot Size 0, rapidly decreases to approximately 0.2 at Pilot Size 20, and then fluctuates slightly around 0.2 for Pilot Sizes between 20 and 80.
* Pilot Size 20: MSE ~ 0.25
* Pilot Size 40: MSE ~ 0.15
* Pilot Size 60: MSE ~ 0.20
* Pilot Size 80: MSE ~ 0.15
* **Kernel (Light Blue):** The light blue line representing the Kernel method starts at approximately MSE 0.85 at Pilot Size 0, decreases to approximately 0.7 at Pilot Size 20, and then gradually decreases to approximately 0.5 at Pilot Size 80.
* Pilot Size 20: MSE ~ 0.7
* Pilot Size 40: MSE ~ 0.6
* Pilot Size 60: MSE ~ 0.55
* Pilot Size 80: MSE ~ 0.5
* **Wiener (Red):** The red line representing the Wiener method starts at approximately MSE 1.0 at Pilot Size 0, rapidly decreases to approximately 0.2 at Pilot Size 20, and then fluctuates slightly around 0.15 for Pilot Sizes between 20 and 80.
* Pilot Size 20: MSE ~ 0.2
* Pilot Size 40: MSE ~ 0.15
* Pilot Size 60: MSE ~ 0.12
* Pilot Size 80: MSE ~ 0.12
* **Wiener-CE (Dashed Dark Blue):** The dashed dark blue line representing the Wiener-CE method starts at approximately MSE 1.0 at Pilot Size 0, rapidly decreases to approximately 0.2 at Pilot Size 20, and then fluctuates slightly around 0.15 for Pilot Sizes between 20 and 80.
* Pilot Size 20: MSE ~ 0.2
* Pilot Size 40: MSE ~ 0.15
* Pilot Size 60: MSE ~ 0.12
* Pilot Size 80: MSE ~ 0.12
* **ZF (Magenta):** The magenta line representing the ZF method starts at approximately MSE 0.2 at Pilot Size 0, and then fluctuates slightly around 0.15 for Pilot Sizes between 0 and 80.
* Pilot Size 20: MSE ~ 0.15
* Pilot Size 40: MSE ~ 0.12
* Pilot Size 60: MSE ~ 0.12
* Pilot Size 80: MSE ~ 0.1
### Key Observations
* The Kernel method has the highest MSE overall, decreasing gradually with increasing Pilot Size.
* The Capon, Wiener, and Wiener-CE methods show a significant decrease in MSE as the Pilot Size increases from 0 to 20, after which the MSE stabilizes.
* The ZF method has the lowest MSE overall and remains relatively constant across all Pilot Sizes.
* For Pilot Sizes greater than 20, the Wiener and Wiener-CE methods perform similarly and have lower MSE than the Capon method.
### Interpretation
The chart demonstrates the relationship between Pilot Size and the performance (MSE) of different estimation methods. The results suggest that increasing the Pilot Size generally improves the performance of the Capon, Kernel, Wiener, and Wiener-CE methods, particularly in the range of 0 to 20. However, after a certain Pilot Size (around 20), the improvement in MSE becomes marginal. The ZF method appears to be less sensitive to Pilot Size, maintaining a relatively low MSE across all values. The Kernel method consistently performs worse than the other methods across all Pilot Sizes. The Wiener and Wiener-CE methods converge to similar performance levels as the Pilot Size increases, outperforming the Capon method.