# Technical Data Extraction: MSE vs. Pilot Size Performance Chart
## 1. Image Classification and Overview
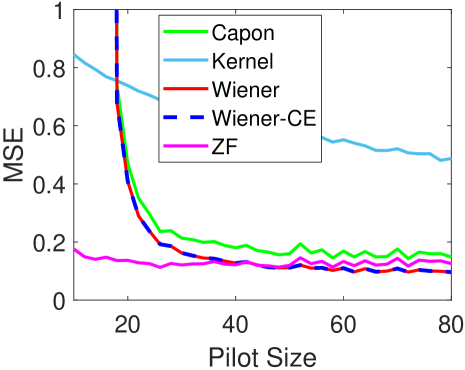
This image is a 2D line graph illustrating the relationship between **Mean Squared Error (MSE)** and **Pilot Size** for five different signal processing or estimation algorithms. The chart evaluates performance (lower MSE is better) as the sample size (Pilot Size) increases.
## 2. Component Isolation
### Header / Metadata
* **Language:** English.
* **Title:** None present within the image frame.
### Main Chart Area
* **Y-Axis Label:** `MSE` (Mean Squared Error).
* **Y-Axis Scale:** Linear, ranging from `0` to `1` with major tick marks at `0`, `0.2`, `0.4`, `0.6`, `0.8`, and `1`.
* **X-Axis Label:** `Pilot Size`.
* **X-Axis Scale:** Linear, ranging from approximately `10` to `80` with major tick marks labeled at `20`, `40`, `60`, and `80`.
### Legend (Spatial Grounding: Top-Center [x: ~0.5, y: ~0.2])
The legend is contained within a black-bordered box and identifies five data series:
1. **Capon:** Solid bright green line.
2. **Kernel:** Solid light blue line.
3. **Wiener:** Solid red line.
4. **Wiener-CE:** Dashed dark blue line (overlaid on the Wiener line).
5. **ZF:** Solid magenta line.
---
## 3. Trend Verification and Data Extraction
### Series 1: Kernel (Light Blue)
* **Visual Trend:** Slopes downward gradually from left to right. It maintains the highest MSE across the entire range of Pilot Sizes.
* **Data Points:**
* Starts at ~0.85 MSE (Pilot Size 10).
* Crosses 0.6 MSE at ~Pilot Size 45.
* Ends at ~0.5 MSE (Pilot Size 80).
### Series 2: Capon (Green)
* **Visual Trend:** Sharp exponential decay initially, then plateaus with minor fluctuations.
* **Data Points:**
* Starts off-chart (>1.0 MSE) at Pilot Size 10.
* Drops sharply to ~0.25 MSE at Pilot Size 25.
* Levels off between 0.15 and 0.2 MSE for Pilot Sizes 40–80.
### Series 3 & 4: Wiener (Red) and Wiener-CE (Dashed Blue)
* **Visual Trend:** These two lines are nearly identical and perfectly overlaid. They show a very sharp initial drop, reaching the lowest MSE values among all algorithms for Pilot Sizes > 30.
* **Data Points:**
* Starts off-chart (>1.0 MSE) at Pilot Size 10.
* Drops to ~0.2 MSE at Pilot Size 25.
* Converges to ~0.1 MSE at Pilot Size 80.
### Series 5: ZF (Magenta)
* **Visual Trend:** Relatively flat compared to others. It starts with the lowest MSE at small Pilot Sizes but is overtaken by the Wiener methods as Pilot Size increases.
* **Data Points:**
* Starts at ~0.18 MSE (Pilot Size 10).
* Slightly decreases and fluctuates around 0.12 - 0.15 MSE.
* Ends at ~0.13 MSE (Pilot Size 80).
---
## 4. Comparative Analysis Summary
| Algorithm | Performance at Low Pilot Size (<20) | Performance at High Pilot Size (80) | Overall Rank (Lower is Better) |
| :--- | :--- | :--- | :--- |
| **ZF** | Best (Lowest MSE) | Good | 2nd |
| **Wiener / Wiener-CE** | Poor (High MSE) | Best (Lowest MSE) | 1st (Optimal at scale) |
| **Capon** | Poor (High MSE) | Moderate | 3rd |
| **Kernel** | Moderate | Worst (Highest MSE) | 4th |
**Key Observation:** The **Wiener** and **Wiener-CE** methods are highly sensitive to Pilot Size; they perform poorly with very few samples but become the most accurate once the Pilot Size exceeds approximately 30. Conversely, **ZF** is the most robust when data is extremely scarce (Pilot Size < 20).