## Chart: I-Don't-Know Rate vs. Layer for Llama-3.2 Models
### Overview
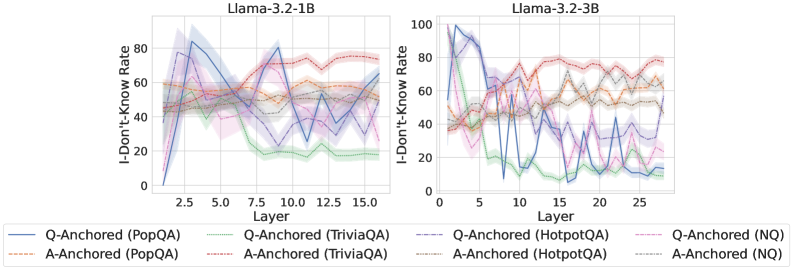
The image presents two line charts comparing the "I-Don't-Know Rate" across different layers of two Llama-3.2 models (1B and 3B). Each chart displays six data series, representing different question-answering datasets (PopQA, TriviaQA, HotpotQA, and NQ) anchored by either the question (Q-Anchored) or the answer (A-Anchored). The x-axis represents the layer number, and the y-axis represents the I-Don't-Know Rate.
### Components/Axes
**Left Chart (Llama-3.2-1B):**
* **Title:** Llama-3.2-1B
* **X-axis:** Layer, with markers at approximately 2.5, 5.0, 7.5, 10.0, 12.5, and 15.0.
* **Y-axis:** I-Don't-Know Rate, ranging from 0 to 80, with markers at 0, 20, 40, 60, and 80.
**Right Chart (Llama-3.2-3B):**
* **Title:** Llama-3.2-3B
* **X-axis:** Layer, with markers at 0, 5, 10, 15, 20, and 25.
* **Y-axis:** I-Don't-Know Rate, ranging from 0 to 100, with markers at 0, 20, 40, 60, 80, and 100.
**Legend (Located below both charts):**
* **Blue Solid Line:** Q-Anchored (PopQA)
* **Brown Dashed Line:** A-Anchored (PopQA)
* **Green Solid Line:** Q-Anchored (TriviaQA)
* **Pink Dashed Line:** A-Anchored (TriviaQA)
* **Orange Solid Line:** Q-Anchored (HotpotQA)
* **Gray Dashed Line:** A-Anchored (HotpotQA)
* **Pink Dash-Dot Line:** Q-Anchored (NQ)
* **Gray Dotted Line:** A-Anchored (NQ)
### Detailed Analysis
**Llama-3.2-1B:**
* **Q-Anchored (PopQA) (Blue Solid Line):** Starts at approximately 0, rises sharply to around 80 at layer 2.5, then decreases to approximately 40 at layer 10, and fluctuates around 40-60 for the remaining layers.
* **A-Anchored (PopQA) (Brown Dashed Line):** Starts around 50, remains relatively stable between 50 and 60 across all layers.
* **Q-Anchored (TriviaQA) (Green Solid Line):** Starts around 60, decreases to approximately 20 at layer 7.5, and then remains relatively stable between 20 and 30.
* **A-Anchored (TriviaQA) (Pink Dashed Line):** Starts around 50, remains relatively stable between 50 and 60 across all layers.
* **Q-Anchored (HotpotQA) (Orange Solid Line):** Starts around 50, remains relatively stable between 50 and 60 across all layers.
* **A-Anchored (HotpotQA) (Gray Dashed Line):** Starts around 50, remains relatively stable between 50 and 60 across all layers.
* **Q-Anchored (NQ) (Pink Dash-Dot Line):** Starts around 50, fluctuates between 40 and 70 across all layers.
* **A-Anchored (NQ) (Gray Dotted Line):** Starts around 50, fluctuates between 40 and 60 across all layers.
**Llama-3.2-3B:**
* **Q-Anchored (PopQA) (Blue Solid Line):** Starts at approximately 90, drops sharply to around 10 at layer 7, and then fluctuates between 10 and 50 for the remaining layers.
* **A-Anchored (PopQA) (Brown Dashed Line):** Starts around 40, fluctuates between 40 and 80 across all layers.
* **Q-Anchored (TriviaQA) (Green Solid Line):** Starts around 70, decreases to approximately 10 at layer 15, and then remains relatively stable between 10 and 30.
* **A-Anchored (TriviaQA) (Pink Dashed Line):** Starts around 30, fluctuates between 20 and 50 across all layers.
* **Q-Anchored (HotpotQA) (Orange Solid Line):** Starts around 40, fluctuates between 40 and 80 across all layers.
* **A-Anchored (HotpotQA) (Gray Dashed Line):** Starts around 60, fluctuates between 40 and 70 across all layers.
* **Q-Anchored (NQ) (Pink Dash-Dot Line):** Starts around 100, fluctuates between 20 and 80 across all layers.
* **A-Anchored (NQ) (Gray Dotted Line):** Starts around 50, fluctuates between 40 and 70 across all layers.
### Key Observations
* The Q-Anchored (PopQA) line shows a significant initial spike in the 1B model, followed by a decrease, while the 3B model shows a sharp drop.
* The Q-Anchored (TriviaQA) line shows a decreasing trend in both models.
* The other lines remain relatively stable across all layers in both models.
* The 3B model generally has a higher I-Don't-Know Rate than the 1B model.
### Interpretation
The charts illustrate how the "I-Don't-Know Rate" varies across different layers of the Llama-3.2 models for different question-answering datasets. The Q-Anchored (PopQA) line's behavior suggests that the model initially struggles with PopQA questions but learns to handle them better in later layers. The decreasing trend of the Q-Anchored (TriviaQA) line indicates that the model improves its ability to answer TriviaQA questions as it progresses through the layers. The relatively stable behavior of the other lines suggests that the model's performance on those datasets remains consistent across all layers. The higher I-Don't-Know Rate in the 3B model may indicate that it is more conservative in its answers or that it is exposed to more challenging questions. The differences between Q-Anchored and A-Anchored versions of each dataset may reflect the model's ability to understand the question versus the answer.