\n
## Diagram: Cascaded CatBoost Model
### Overview
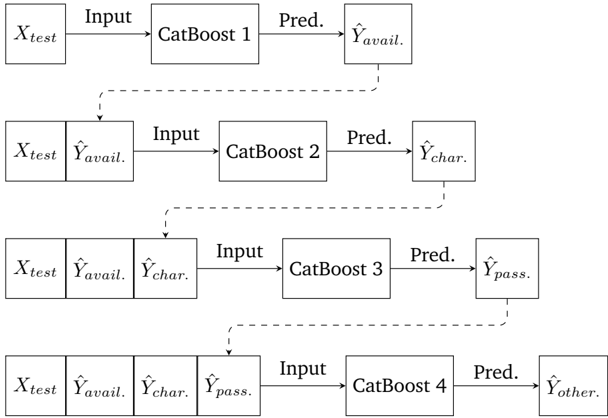
The image depicts a diagram of a cascaded machine learning model using CatBoost. The model consists of four CatBoost models (CatBoost 1 through 4) arranged sequentially. Each model takes an input, makes a prediction, and the prediction is then used as an input for the next model in the cascade.
### Components/Axes
The diagram consists of rectangular blocks representing the CatBoost models and input/output data. The blocks are connected by arrows indicating the flow of data. The labels within the blocks are:
* **Input:** Represents the input data.
* **CatBoost 1, CatBoost 2, CatBoost 3, CatBoost 4:** Represents each CatBoost model.
* **Pred.:** Indicates the prediction output of each CatBoost model.
* **Ŷavail:** Prediction from CatBoost 1.
* **Ŷchar:** Prediction from CatBoost 2.
* **Ŷpass:** Prediction from CatBoost 3.
* **Ŷother:** Prediction from CatBoost 4.
* **Xtest:** The initial input data.
The arrows are of two types: solid arrows representing the primary data flow, and dashed arrows representing the feedback of predictions to subsequent models.
### Detailed Analysis / Content Details
The diagram shows a sequential process:
1. **CatBoost 1:** Takes `Xtest` as input and produces the prediction `Ŷavail`.
2. **CatBoost 2:** Takes `Xtest` and `Ŷavail` as input and produces the prediction `Ŷchar`.
3. **CatBoost 3:** Takes `Xtest`, `Ŷavail`, and `Ŷchar` as input and produces the prediction `Ŷpass`.
4. **CatBoost 4:** Takes `Xtest`, `Ŷavail`, `Ŷchar`, and `Ŷpass` as input and produces the prediction `Ŷother`.
The input data `Xtest` is consistently provided to each CatBoost model. The predictions from previous models are fed as additional inputs to subsequent models. The dashed arrows indicate that the predictions are being used as features in the next stage of the cascade.
### Key Observations
The diagram illustrates a multi-stage prediction process where each CatBoost model refines the prediction based on the inputs from the previous models. This suggests a hierarchical or ensemble approach to prediction. The use of previous predictions as inputs implies that the models are learning to correct errors or improve accuracy iteratively.
### Interpretation
This diagram represents a stacked generalization or cascading model. The purpose of this architecture is likely to improve prediction accuracy by leveraging the strengths of multiple CatBoost models. Each model in the cascade learns from the errors of the previous models, potentially leading to a more robust and accurate final prediction (`Ŷother`). The inclusion of `Xtest` at each stage suggests that the original features are still considered alongside the predictions from previous models. This could be to prevent error accumulation or to allow the models to revert to the original features if the predictions are unreliable. The naming of the predictions (`Ŷavail`, `Ŷchar`, `Ŷpass`, `Ŷother`) suggests that each model is focused on predicting a specific aspect or category of the target variable. Without further context, it's difficult to determine the exact meaning of these names, but they likely relate to the specific problem being solved.